Long thought to be “too big to fail,” the Great Barrier Reef (GBR) is under serious threat and its outlook is dire.
One of the latest victims of global warming, baby coral in Australia’s GBR have declined by 89 percent due to deadly ocean heat waves and mass bleaching in 2016 and 2017, according to a study published in April 2019. The ability for adult coral in the northern regions of the GBR to recover from bleaching events dropped by 93 percent – dead coral can’t make new baby coral.
Further loudening the climate crisis alarm, the Australian government last August officially downgraded the health of the GBR’s ecosystem from poor to very poor, publicly affirming what marine scientists already know: parts of the GBR, which has supported marine life for centuries, is now itself on life support.

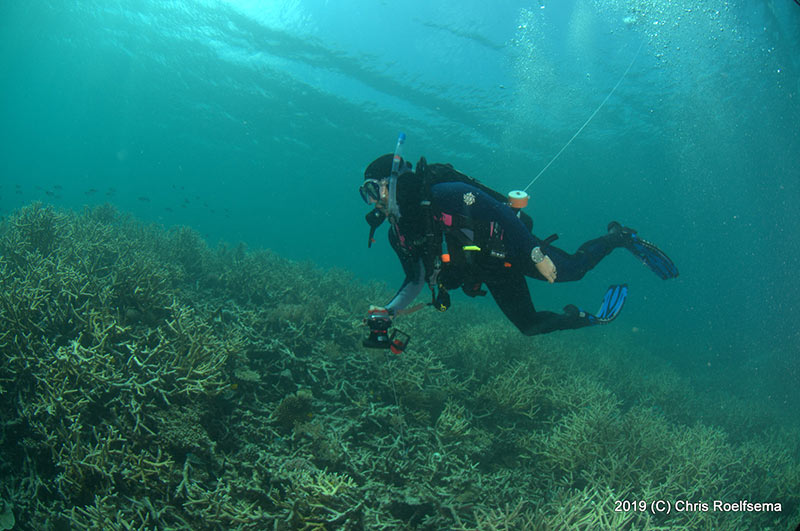
Acropora species, or branching coral, growing 12 cm per year on Heron, Southern Great Barrier Reef. Credit: C. Roelfsema 2019
“The reef is definitely not as healthy as it was 20 years ago and the mass bleaching effects, particularly in the last five years, have had severe impacts,” says Dr. Chris Roelfsema, a researcher and lecturer in the Remote Sensing Research Centre, School of Earth and Environmental Sciences at Brisbane’s Queensland University. “We’ve been witnessing this decline from our research and fieldwork and there is no doubt that climate change is the culprit. There is still a lot of life along the GBR so I won’t declare that it’s dead but it is absolutely threatened and the coral, which is the support system for thousands of species, is under serious stress.”

The bleaching impacts are seen on the GBR ecosystem around Lizard Island, an island on the GBR roughly 240 km north of Cairns and 27 km off the coast. In just two short months (Mar-May 2016) the healthy coral on the right turned a ghostly white. Photo credit: The Ocean Agency / XL Catlin Seaview Survey.
The Need for Maps
The challenge to help conserve the world’s largest coral reef has been due in part to the lack of a complete map of the GBR’s topography, its habitat communities and different coral types. Without the big picture of a comprehensive map of the entire ecosystem, it has been difficult to dive under the surface to better understand the GBR’s life, monitor it and develop protective strategies.
A new mapping technique, however, may help scientists turn the tide. A project team led by Roelfsema combined satellite imagery, object- based image analysis (OBIA) software, coral knowledge and field data to successfully produce the world’s first-ever topographic map of the GBR’s 2,900 reefs. With this new mapping approach, scientists now not only can better understand where coral and specific habitat types are likely living, they’ll have the tools to start charting a path towards rescue, restoration and resilience.
“Fulfilling a 20-year-long vision, Dr. Roelfsema has combined these tools to develop a semi-automated approach to mapping the geomorphology of shallow GBR reefs and their benthic communities over a large scale”
Mapping Issues
Roughly the same area as Italy, the GBR stretches approximately 2,300 km along the coast of Queensland in northeastern Australia. That’s about the same length as the west coast of North America, from Vancouver, Canada to the Mexican border. A World Heritage Site, the GBR composes 2,900 individual coral reefs, 600 continental islands, 300 coral cays and about 150 inshore mangrove islands. Its intricate architecture provides a home for thousands of different species including jellyfish, mollusks, fish, sharks, rays, whales, dolphins and microorganisms.
According to the Great Barrier Reef Foundation, the GBR is valued at A$56 billion (about US$34.4 billion), contributes more than A$6.4 billion (about US$3.9) each year to the Australian economy and supports around 70,000 jobs.
Despite its significance, no systematic mapping program exists for the GBR. There is no current and comprehensive map of the individual GBR’s geomorphology (topography) or benthic composition (reef bottom flora and fauna), and the full extent of its coral habitat is not well mapped.
To date, the highest quality overview map of the GBR is a 10-year-old coral reef map produced from Landsat imagery showing the outline of each reef. Although that map shows the locations of the GBR’s reefs, it doesn’t provide the thematic detail, accuracy or ecosystem depth scientists need for their work.
Underwater surveys provide meticulous records of the health and biodiversity of coral reefs, but they are costly, time intensive and only provide a narrow extent – characterizing a coral habitat of 500 square meters (about the area of two tennis courts) takes a 30-minute dive. With that method, mapping only the GBR’s 28-square-kilometer Heron Island would take three years of continuous diving. What scientists have needed is a map that marries detail and large-area coverage.
The results of Roelfsema’s eCognition pilot project in 2016 showing a geomorphic zonation map of 20 reefs in the Southern Great Barrier Reef, Australia. The map was derived using object-based image analysis, sub-surface reflectance and water depth from Landsat 8 OLI imagery in conjunction with significant wave height.
Mapping Solution
With the help of higher resolution satellites, the availability of ancillary water data, the sophistication of intelligent OBIA tools, the improvements in machine learning, and advancements in computing power, Roelfsema has been able to produce exactly that. Fulfilling a 20-year-long vision, he’s combined these tools to develop a semi-automated approach to mapping the geomorphology of shallow GBR reefs and their benthic communities over a large scale. It’s a crucial first step in helping scientists and conservationists to answer multitude questions about the world’s largest coral reef ecosystem.
“Mapping the geomorphic zones and reef habitats helps us understand how the GBR as a whole is functioning,” says Roelfsema. “We can see how it’s growing, where it’s growing and when it stops growing. We can see the composition of the reef structure and begin to assess benthic types. That foundational understanding can help identify at-risk zones and lead to better management of the GBR. It’s insight we’ve never had before.”
Dr. Eva Kovacs collects a photo validation data survey within a 1m2 footprint along the GBR. At the sur- face, she tows a GPS unit to track her position. Credit: C. Roelfsema 2019.
A Development in Waves
Since 2007, Roelfsema has been experimenting with satellite data and Trimble eCognition OBIA software to develop a scalable, coral reef mapping approach.
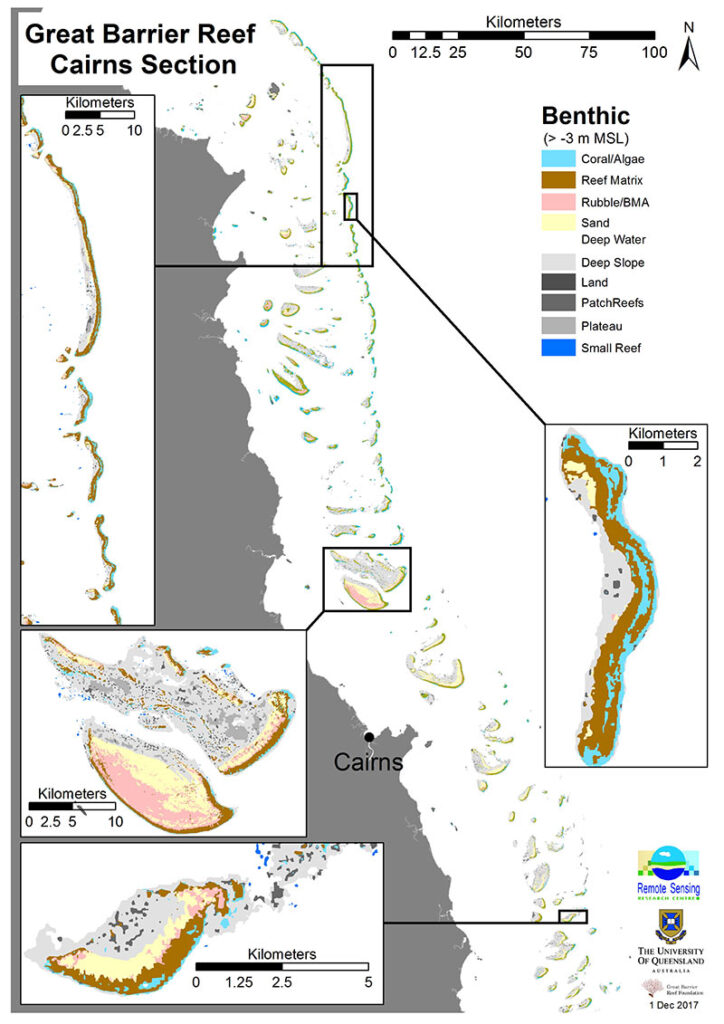
In 2016, he led a pilot project using eCognition technology to produce geomorphic zonation and benthic composition maps of 20 reefs covering a 250-sq-km area in the southernmost section of the GBR.
The success and promise of that study led to funding in 2017 to expand the technique across 237 reefs in Cairns/Cooktown (CC), a group of northern reefs about 10 to 50 km offshore that are in dire condition. Similar to the pilot, their aim was to classify and map the geomorphology, benthic types and coral types of these shallow reefs using similar data sources and the previously established eCognition rules. Although this would push the technique into unchartered territory, Roelfsema was confident in the software’s ability.
“The power of the software is that you can turn your knowledge into rules that it’ll strictly follow,” he says. “We can tell it all that we know about coral, reefs, slopes, waves and benthic communities and it uses those biophysical properties, pixel characteristics and spatial relationships together to classify features.”
Unique and special to eCognition is its ‘cognitive analysis.’ Similar to how our brain identifies objects, when the software classifies an object it not only considers its color or texture but its spatial relationship to neighboring objects. Adding that relationship analysis layer greatly strengthens the classification.
Unlike in the pilot, Roelfsema’s team had little first-hand knowledge of the 237 CC reefs. To collect field data, they performed dive surveys of 23 individual reefs. They recorded the topography, benthic and substrate compositions, and took thousands of geolocated photos at regular intervals while towing a GPS device at the surface. The georeferenced photos were processed into meaningful information about each reef’s benthic communities.
They acquired three, 30-m-resolution Landsat 8 Operational Land Imager (OLI) images to cover the 3,000-sq-km area of interest (AOI). A third party used pansharpening techniques to create a 15-m seamless mosaic of the images. Using a physics-based algorithm they derived water depth, slope and wave values. Roelfsema also supplemented his own field survey data with attribute data gathered from other citizen science projects.
With the input data sources prepared, Roelfsema readied the OBIA technology, customizing the previously developed eCognition rule sets for the 237 specific CC reefs. “Once you have master rule sets, adjusting them is a simple exercise,” says Roelfsema. “It’s another advantage of OBIA. It’s flexible, it’s easily scaled and it’s easily repeatable.”
Distinguishing the Underwater Jungle
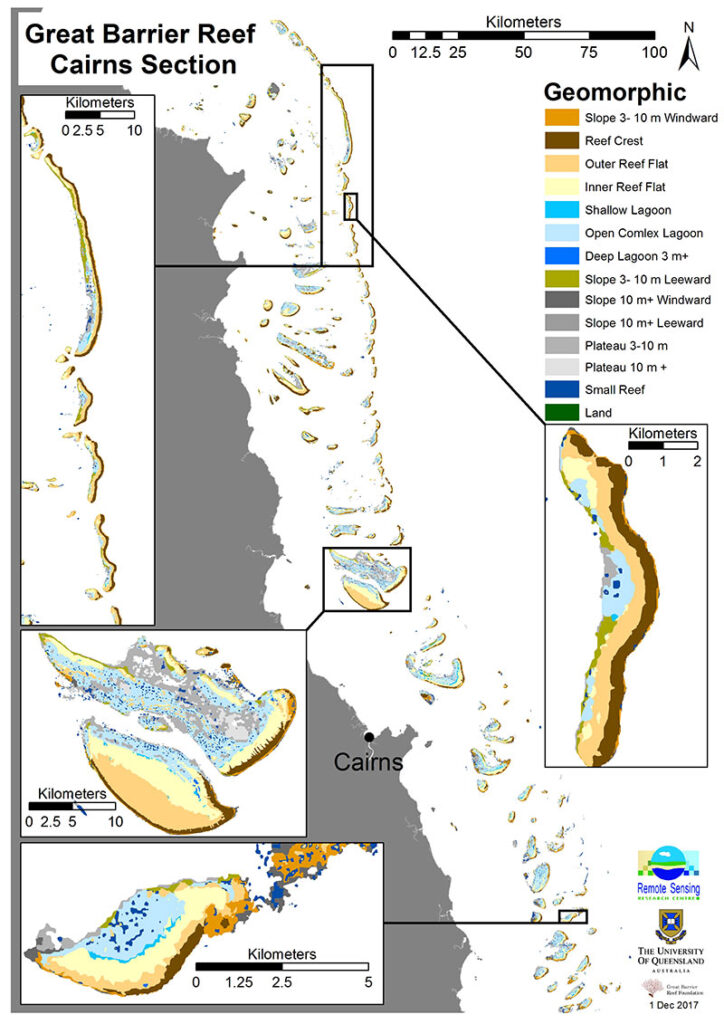
eCognition first concentrates on classifying geomorphic zones. Methodically moving from one reef to the next, it analyzes the depth values of the image mosaic and distinguishes reefs from non-reefs – any feature above 20 m is reef – to create a reef map. It then differentiates between the shallow reef top (above 3 m) and not reef top. Within the identified reef top, it classifies shallow geomorphic zones such as reef crest, inner reef flat, outer reef flat and lagoon.
Then for the deeper, not-reef zones it uses depth, wave and wind information to distinguish exposed and sheltered slopes – objects with a gradient of more than 10 degrees are slopes – and plateaus (less than 5 degrees). Once all the geomorphic zones are classified, the software uses field data and depth characteristics to differentiate benthic habitats such as coral/ algae, seagrass, rock, rubble and sand.
In an additional step, eCognition divides the classified slopes into hard substrate and soft substrate (sand) and exports it as a vector layer in ArcGIS. Referencing detailed field data on coral types, along with wave, depth and slope data, a team uses an ecological model to create a predictive map of dominant coral types – branching, massive, and plate – for each reef.
In total it took eCognition only 45 minutes to produce geomorphic and benthic habitat maps for all 237 of the CC reefs.
“That’s mind blowing,” says Roelfsema. “We have never been able to map so many reefs with such little field data to that level of detail. And in such little time.”
At the end of 2017, Roelfsema presented the mapping results to GBR Marine Park Authority (GBRMPA) officials to not only validate the approach but to illustrate what this kind of information could mean for the whole GBR. Impressed by the maps, the GBRMPA invited Roelfsema to submit a proposal for mapping the entire ecosystem, and in early 2019, he was granted permission and funding to scale the methodology to all 2,900 reefs of the GBR.
The GBRHMP
A three-year initiative, the GBR Habitat Mapping Project (GBRHMP) aims to develop a comprehensive, seamless map of the GBR that details the reef’s geomorphology, its benthic habitats and specific coral types. And last October it already bore its first significant fruit: Australia’s, and the world’s, first-ever map of the GBR’s geomorphology, its slopes, plateaus and ridges along each individual reef.
Roelfsema and his team created that map based on his eCognition mapping technique, with a few modifications. Instead of Landsat, they acquired 129 Sentinel-2 images, which have a swath width of 290 km and a 10-m spatial resolution (four visible bands). Those scenes were processed into seamless mosaics, and water depth, slope and wave values were derived using the same previously established algorithm. They also collected any and all field survey data they could find on the GBR to incorporate into the classification process. To create a larger reference dataset, they applied the same eCognition rules from the initial set of 237 geomorphic reef maps to an additional 63 GBR reefs, producing geomorphic and benthic habitat maps for 300 reefs total.
Given the enormity of the GBR and the terabytes of data to be analyzed, the team switched the classification and mapping process to Google Earth Engine (GEE). Using the eCognition-based reference dataset of 300 reefs, they created a set of training and validation points. Those points were fed into GEE’s machine-learning classifier to systematically classify and produce a geomorphic map of the whole GBR. They then applied OBIA neighborhood rules to strengthen the map results.
In late October, they presented the premiere GBR geomorphic map to the GBRMPA, and although officials “loved it,” Roelfsema’s team made improvements before delivering the finalized map in December. In 2020, the team is refining the map to classify and map the GBR’s benthic communities, and in 2021, they will layer in specific coral types. All maps will be publically available through the GBRMPA.
“This map has been a dream come true,” says Roelfsema. “We’re providing more detail than scientists have ever had before. Now they’ll be able to make spatial, ecological and biophysical connections that they haven’t been able to before. And, it’s only going to get better.”
That sounds like just the medicine the GBR needs.
Next Stop: The World
Having proved that they can map the GBR, Roelfsema and his team have been a lead mapping partner in the Allen Coral Atlas (ACA), a massive project to produce geomorphic and benthic-type maps of the world’s 231,000 coral reefs. The ACA is funded by the late Paul Allen’s philanthropic organization Vulcan.
Using 3.7-m-resolution imagery from Planet Dove satellites, field data and geo-ecological models, Roelfsema’s team creates eCogni- tion-based training maps that are input into Google Earth Engine for classification and mapping. Once completed, the reef maps are posted to the ACA’s online atlas (https://allencoralatlas.org).
To date, they have mapped several individual reefs around Hawaii, Indonesia, Belize, Tahitii and Sri Lanka; large reef systems in the GBR Cairns region, Fiji, Tonga and Vanuata have also been done. Reefs around western Micronesia and northern Caribbean are being mapped, as well. The ACA expects to have the world’s coral reefs mapped by fall 2021.
