DEREK EDINGER / CO-FOUNDER / VP STRATEGIC PARTNERSHIPS
ZACKARY DOWNEY / DATA SCIENTIST
Ursa Space Systems Inc. (Ursa) is a satellite imagery analytics company whose focus is on commodities and the financial markets. Ursa aggregates and analyzes satellite-based radar to build proprietary data layers resulting in unbiased, consistent, all-weather location-based services and measurements. Ursa’s unique access to most of the world’s current and future radar satellites and our unique understanding of how to apply machine vision and machine learning to radar, gives the reliability that has hindered optical systems and allows Ursa to extract asymmetric value from a single image. (Radar is a unique form of satellite imaging that forms images independent of lighting conditions and weather.)
The company currently accesses 12 different commercial or open-source radar satellites which they refer to as their “virtual constellation” to provide data for their analytics products. Ursa generally builds algorithms, analytics, and tools that are “sensor agnostic” to give them the most flexibility and capacity in utilizing these different satellites. This differs from other analytics firms which leverage radar capabilities of “coherent change detection” which are quite powerful, but limit use to a single sensor with further limited imaging parameters on that sensor.
In addition, many of Ursa’s algorithms can create useful products from low resolution imagery. This is a significant advantage over optical imagery sources since lower resolution radar images can cover 50-200+ km areas which can be the size of a whole city or industrial area in a single scene. That said, Ursa also recognizes the different traits of each radar satellite and will leverage them for different applications.
For coarse-level ship and vehicle detection, Ursa utilizes ESA’s Sentinel-1A and 1B satellites. Data from these satellites is essentially free, has broad-area global coverage, and has a moderate revisit rate, but generally cannot be tasked by a user.Ursa also accesses 10 commercial satellites. Of these, they have special commercial agreements in place with Airbus for access to TerraSAR-X and TanDEM-X satellites and with e-GEOS for access to COSMO-SkyMed 1/2/3/4 satellites. Ursa is also in negotiation with other parties for similar agreements.These include existing radar satellite operators as well as emerging traditional and SmallSat manufacturers and operators.
Ursa has found their radar supplier relationships to be win-win in many respects. Existing suppliers are all public/private partnerships which generally focus on defense, security, and civil missions. By partnering with Ursa, these suppliers can access new commercial and “big data” markets which bring incremental revenue and often for areas of the world where their satellite is underutilized. Further, Ursa is a U.S.-based company and can help access U.S. government customers and markets that can be challenging to access by current, foreign-based suppliers. Finally, Ursa is working with emerging, SmallSat suppliers who need a knowledgeable and agile data customer and where Ursa can be first to leverage their revolutionary capabilities.
GLOBAL OIL STORAGE MONITORING
At this point, Ursa is largely focusing their analytics on global commodity trading. Ursa delivers information products to provide economic insights about the Oil and Gas Industry. One of the products Ursa is offering is Global Oil Storage monitoring.
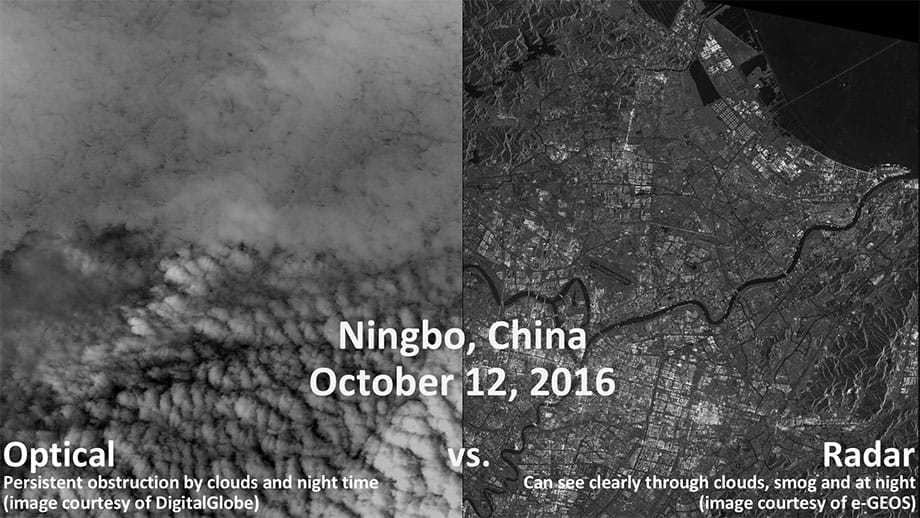
Ursa began this product looking at China. The company chose to start with China because focusing here exemplified its business model. China is an incredibly important global leader in the Oil and Gas market. It is the number one importer of crude oil, and number two consumer of crude oil, behind the United States. However, there is very little information about China’s storage and usage of its crude oil. China is also subject to an incredible amount of cloud cover, causing issues when relying solely on optical satellites. By using radar satellites, Ursa has become the first consistent and reliable dataset on China’s oil inventories. See Figure 1.

Figure 1. Comparing optical and radar images over Ningbo, China, shows the need for multiple types of satellite technology and data to fulfill customer needs.
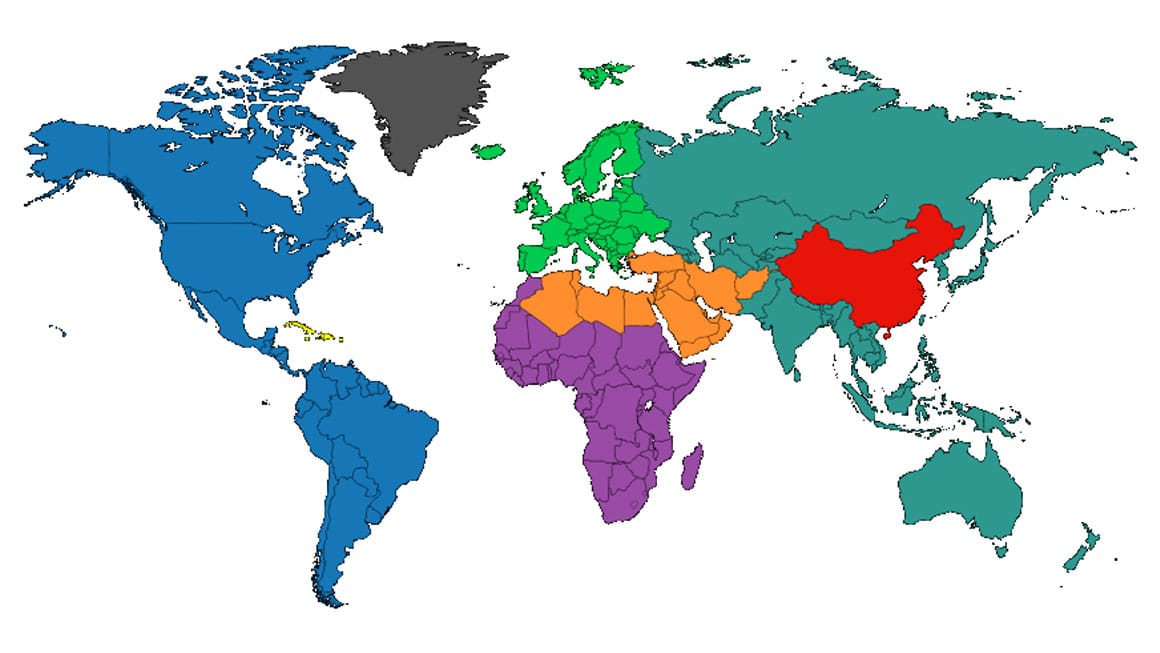
Beyond China, Ursa has products in Beta for the Caribbean, Middle East/North Africa (MENA), and Europe. These regions also suffer from a lack of reliable and consistent information. Caribbean crude oil inventory movement can be an indication of future inventories in the U.S. and provides an added edge to users. The Middle East/North Africa is a source of much discussion and media attention in regards to the Oil and Gas markets, due to its key role as a global crude oil producing region. Ursa will be growing to a full global expansion in early 2018. See Figure 2.

Figure 2. Ursa’s technology and capabilities allow for global expansion of its Oil Storage product, which will be fully built out by early 2018.
Why does information on oil inventories provide a value or “edge” to financial or Oil and Gas institutions? In financial markets, profit and edge come from asymmetric information. For the Oil and Gas industry, there is value in information that provides more knowledge to the recipient. Ursa is able to use satellite-derived data for its customers to provide competitive advantage, increased efficiency, and decrease risk for the user.
China oil storage data is an example use case of solving a customer’s problem with satellites and big data analytics.There are numerous other problems that can be solved with this approach as well.
Before providing results from Ursa data on China oil storage, following is some context.
The combination of global supply and global demand of oil determines oil prices – a constantly shifting value. To help customers better determine this balance of supply and demand, there is a ìbalance sheetî commonly used across the energy industry:
Production + Imports – Exports – Runs = Inventory Change
Production is oil produced (i.e. pumped out of the ground) in that country, Imports are imported oil, Exports are exported oil, Runs are refinery runs which represent “implied demand”, and Inventory Change represents the change in oil inventory which balances the equation.
By having reliable and consistent data on inventory change, users can calibrate the other inputs with more confidence and find discrepancies. Different parts of the Chinese government, including the National Bureau of Statistics and the General Administration of Customs, release estimates on the additional four variables in the balance equation, while the inventory change is calculated based from them. This causes a lack of confidence and risk in the entire balance. If Runs information for China matters, then an inventory measurement is needed to give a user more confidence in what that implied demand for oil is.
“By using radar satellites, Ursa has become the first consistent and reliable dataset on China’s oil inventories.“
Other organizations and businesses use customs and shipping information to estimate crude oil imports and exports from China, which provide some value and estimate of demand, but there is still a level of uncertainty once the oil travels inland into storage. The combination of this import/export data and Ursa’s storage data provide a high level of confidence to what is actually happening with Chinese crude demand.
Ursa has been tracking Chinese crude inventories since November 2016, and has seen large increases in Chinese inventories in late May and early June of 2017. Ursa is able to provide information before any other source, including the government data that comes out of China (which is 1-2 months behind).
An example of how Ursa’s data can be used is the balance sheet use case. Consider that China’s imports, exports, production, and runs data are not reported until at least 2-4 weeks after the end of the month in question. If the amount of runs drops significantly, it would appear that demand may be slowing (not considering seasonality, general yearly trends, etc.).
Economists, analysts, and traders could alter their short-term or long-term models for crude oil prices based on supply and demand, which may lead to a changed recommendation for buy/sell decisions and therefore could affect the market. There is value to knowing this outcome weeks in advance of everyone else. Since Ursaís data correlates to the general movement of government data, having this information 2-4 weeks ahead of time, especially along with import/export data, allows the user to lock down certain aspects of the balance sheet, and even go so far as to predict the runs number from China.
Consider a specific example: In July, 2017, Chinese imports of crude oil fell from 8.79 mbd (million barrels per day) to 8.18 mbd. Most would see this as a sign of falling refinery activity, and could believe this to be a bad sign for future demand via imports. However, although one variable of the equation is dropping significantly, it is quite possible that other variables (i.e. production, exports, and most importantly for our case, inventory change) could balance this out. If exports and production remain somewhat constant from the previous month, which is relatively common, then the only missing piece to understanding refinery activity/runs ahead of time is inventory change.
If Ursa’s storage measurement goes up over the month of July, then it appears that runs will drop accordingly. However, if Ursa’s storage measurement goes down enough to balance out the drop in imports coming into China, then it is entirely possible that runs will remain the same, or possibly even rise, all depending upon the storage change in that month. Only Ursa provides a consistent and reliable enough dataset at this point to give an answer to that question, 2-4 weeks before anyone else will have that information.
The China oil storage use case is just one application for this technology and the same model and approach can be applied to many applications in the commercial and government markets including measurement of other commodity storage (coal, iron, copper), ship tracking, oil drilling activity, and many others.
As described in this article, these products for new markets take a different approach where focus is needed on the problem and delivering value to these customers who may be unaccustomed to satellite imagery and big data analytics. However, the upside is considerable.
Satellite big data analytics based on traditional markets was estimated at $3-6B per year by Northern Sky Research (NSR) and Euroconsult in late 2016. (1,2) However, NSR has recently increased this estimate in early 2017 to $15.8B by including some of these new markets. (3) Even this recent update may be too conservative as not all commercial markets may have been considered. As an example, the oil and gas analytics market alone is predicted to grow to $36B by 2024 with a 19% CAGR. (4)
Ursa believes there is a bright future for analytics for the global commodities and financial markets which, in turn, creates a bright future for satellite imagery suppliers which fuel these analytics.
Endnotes:
1. Keith, A., “Earth Observation Manufacturing, Data Markets Continue Expansion,” Euroconsult, September 15, 2016.
2. Basu, P., “‘Big Data’ Leap in EO Markets,” Northern Sky Research, October 1, 2016.
3. Basu, P., “Demystifying Satellite Big Data,” Northern Sky Research, April 26, 2017.
4. “Oil and Gas Analytics Market to Reach US$35.78 Billion by 2024,” Transparency Market Research, June 3, 2016.


