MATTEO LUCCIO / CONTRIBUTOR / PALE BLUE DOT LLC / WWW.PALEBLUEDOTLLC.COM
TellusLabs, co-founded by Drs. David Potere and Mark Friedl in 2016, builds systems for environmental intelligence, mostly using satellite Earth observation (EO) data to help monitor food production. Potere is now the company’s CEO and Friedl its Chief Science Officer. The company predominantly stores its data on Amazon Web Services, but also uses Google Cloud.
StreetLight Data, founded by Laura Schewel in 2011, builds systems to help transportation planners and others understand travel patterns, mostly using crowdsourced data acquired from third parties. It stores its data on Google Cloud. In the crowded market for cloud-based, big data, geospatial analytics, these two companies represent two different but overlapping approaches.
For this fourth installment in the series about companies that are using geospatial and other data as inputs for complex analysis, I talked to:
Nick Malizia, Head of Data Science at TellusLabs, and Laura Schewel, CEO and founder of StreetLight Data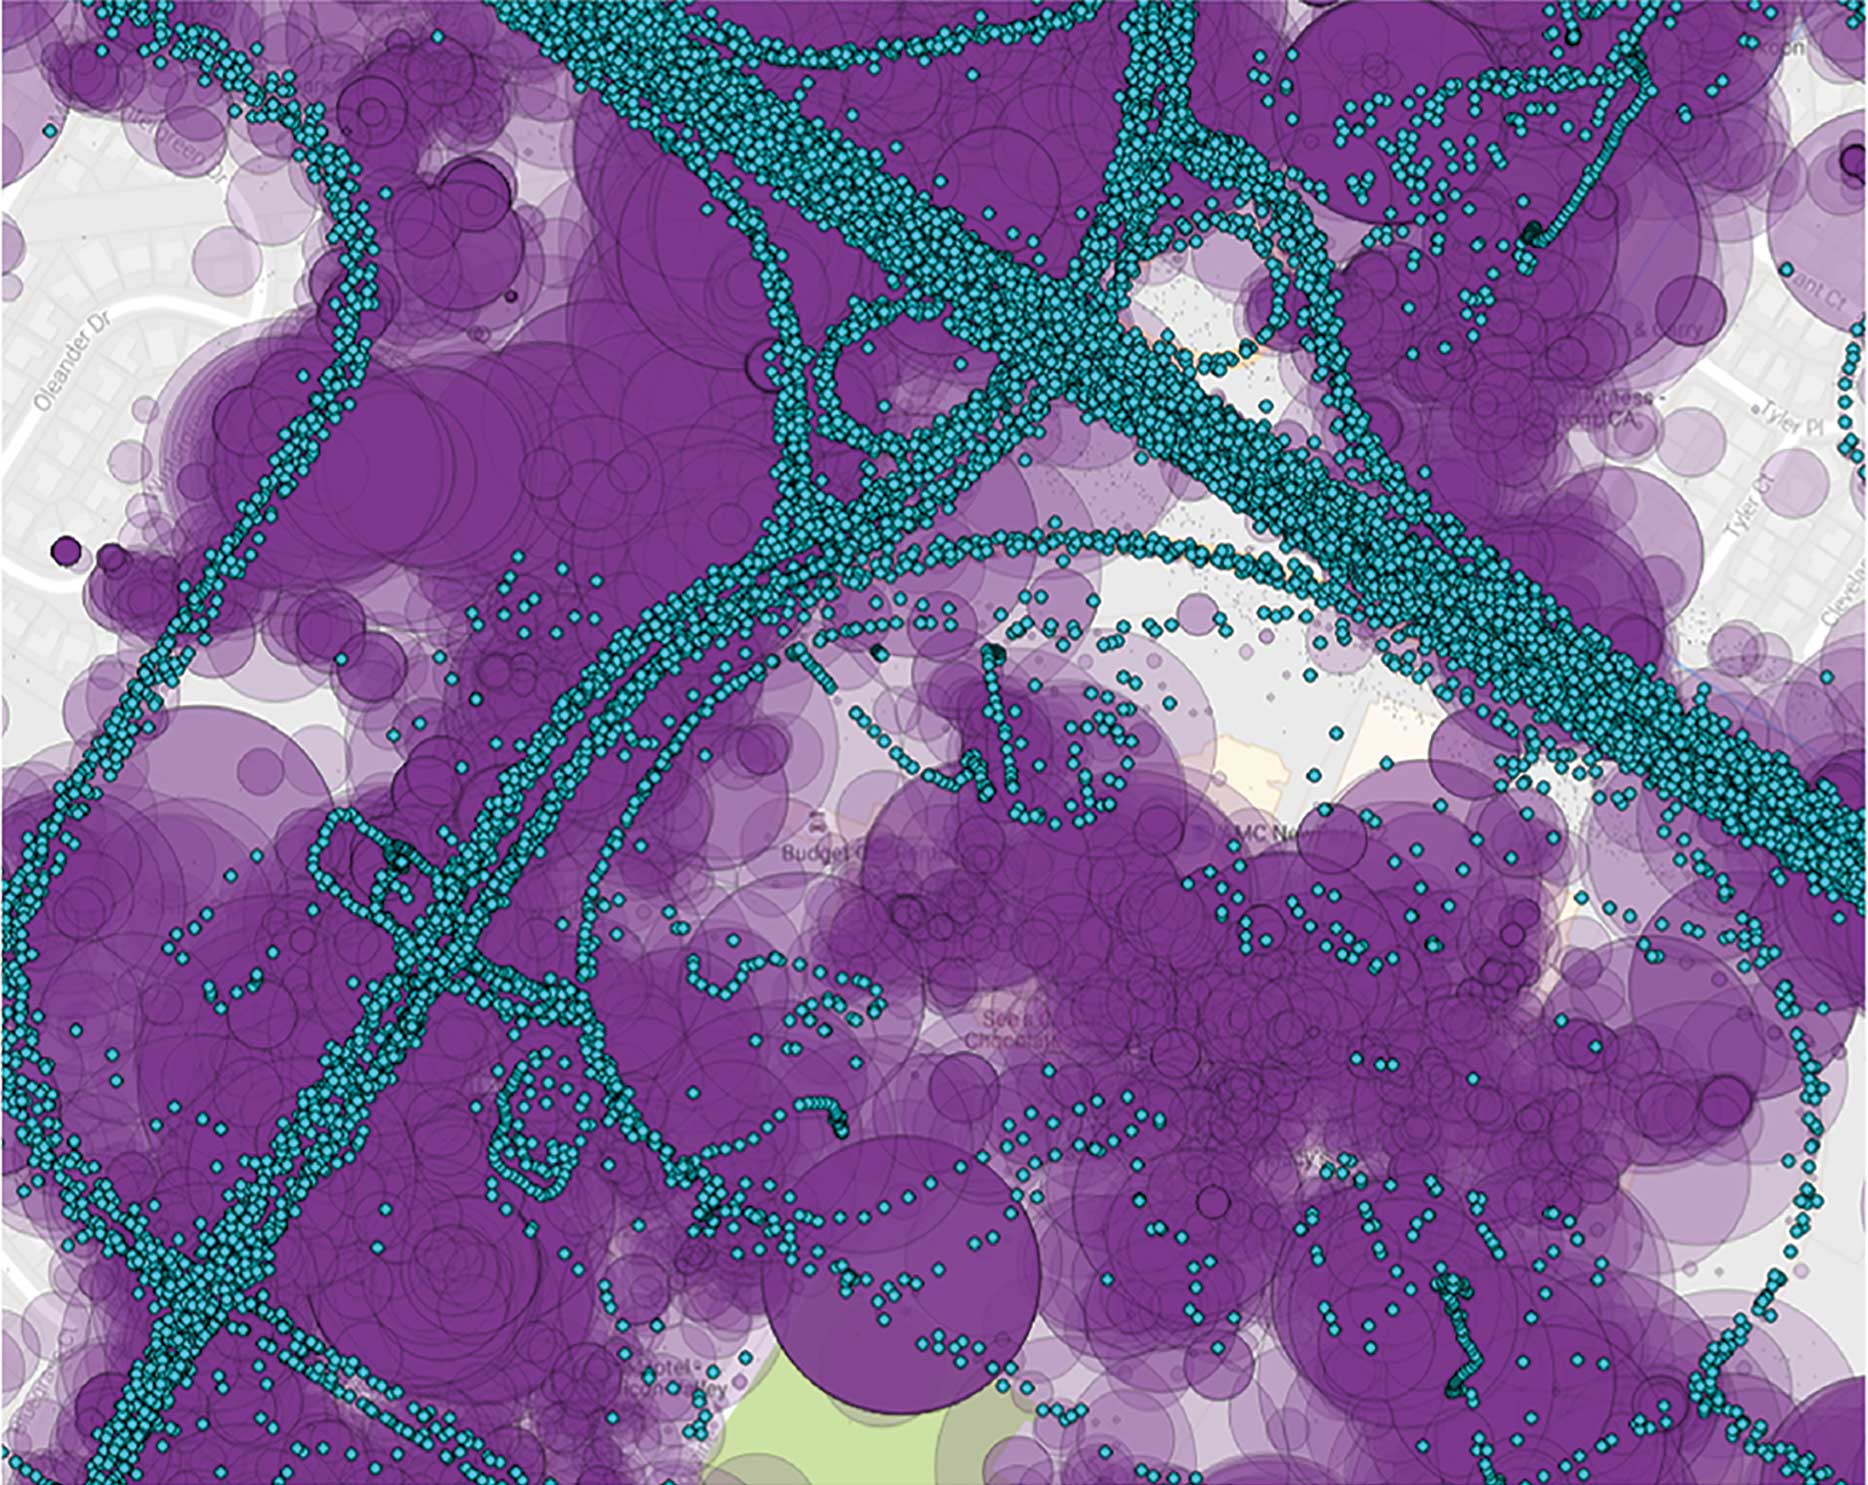
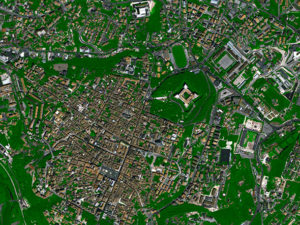
FIGURE 1.
Visualization of location data created by smartphones (purple) and connected trucks (turquoise), courtesy of StreetLight Data.
TellusLabs
VISION

Nick Malizia, Head of Data Science at TellusLabs
Malizia has been in geography for almost 20 years. He earned bachelor’s and master’s degrees in geographic information science and a Ph.D. in geography with a focus on spatial analysis. “I studied under a spatial econometrician, building explanatory and forecast models using traditional econometrics methods that take space into account, but I also did a fair bit of work on spatial optimization,” he recalls. He worked for a few years at the Boston Consulting Group as one of the early members of its geospatial analytics team, then joined TellusLabs.
There is a vast amount of accumulated EO data, now growing at a faster rate than ever, and computing resources are available to analyze it, which were not broadly available five or ten years ago, Malizia explains. “You couple that with a lot of the machine learning methods that have been developed and democratized and you set yourself up for a very interesting period, where this really has the opportunity to take off. David and Mark saw that opportunity and wanted to take advantage of it,” he says. “We are trying to revolutionize what is possible with regards to monitoring the world’s food supply, using the tools that are now available to us.”
BUSINESS MODEL
Tellus has a subscription product, called Kernel, which enables users to monitor the condition of certain crops around the world every day of the year. “You can log in in August and see the condition of the soy beans and the corn in the United States and see how the wheat harvest is going, or you could log in in February and see the same crops in South America,” says Malizia.
Kernel also has a modeling component, which the company uses to forecast the health of crops over the course of a year based on observations in previous years and current conditions on the ground. “That allows people who are interested in these commodities to take an educated position in terms of how they are trying to manage their risk on them,” Malizia explains.
“We are trying to revolutionize what is possible with regards to monitoring the world’s food supply, using the tools that are now available to us.”
-Nick Malizia, TellusLabs
TellusLabs is also working with a group of partners, such as large agribusinesses, seed companies, and food producers, to integrate its technology into their businesses. These companies have a vested interest in getting a very granular look at how their crops are doing or how crops are doing globally. “It runs the gamut from people who are interested in the global supply and demand balance sheet, to people who are interested in specific field-scale insights, where we are trying to work across that spectrum,” says Malizia.
DATA SOURCES
TellusLabs mostly uses satellite data, especially from MODIS, Landsat 7 and 8, and Sentinel-2. It also uses data from several weather sources, as well as on-the-ground truth data where available. “The lion’s share of what we use for our global monitoring product is the MODIS sensor, because it gives us the longest continuous record at a scale that is manageable in terms of computing and because the imagery’s spatial resolution provides the directional answer that we need to do our global monitoring work,” Malizia explains.
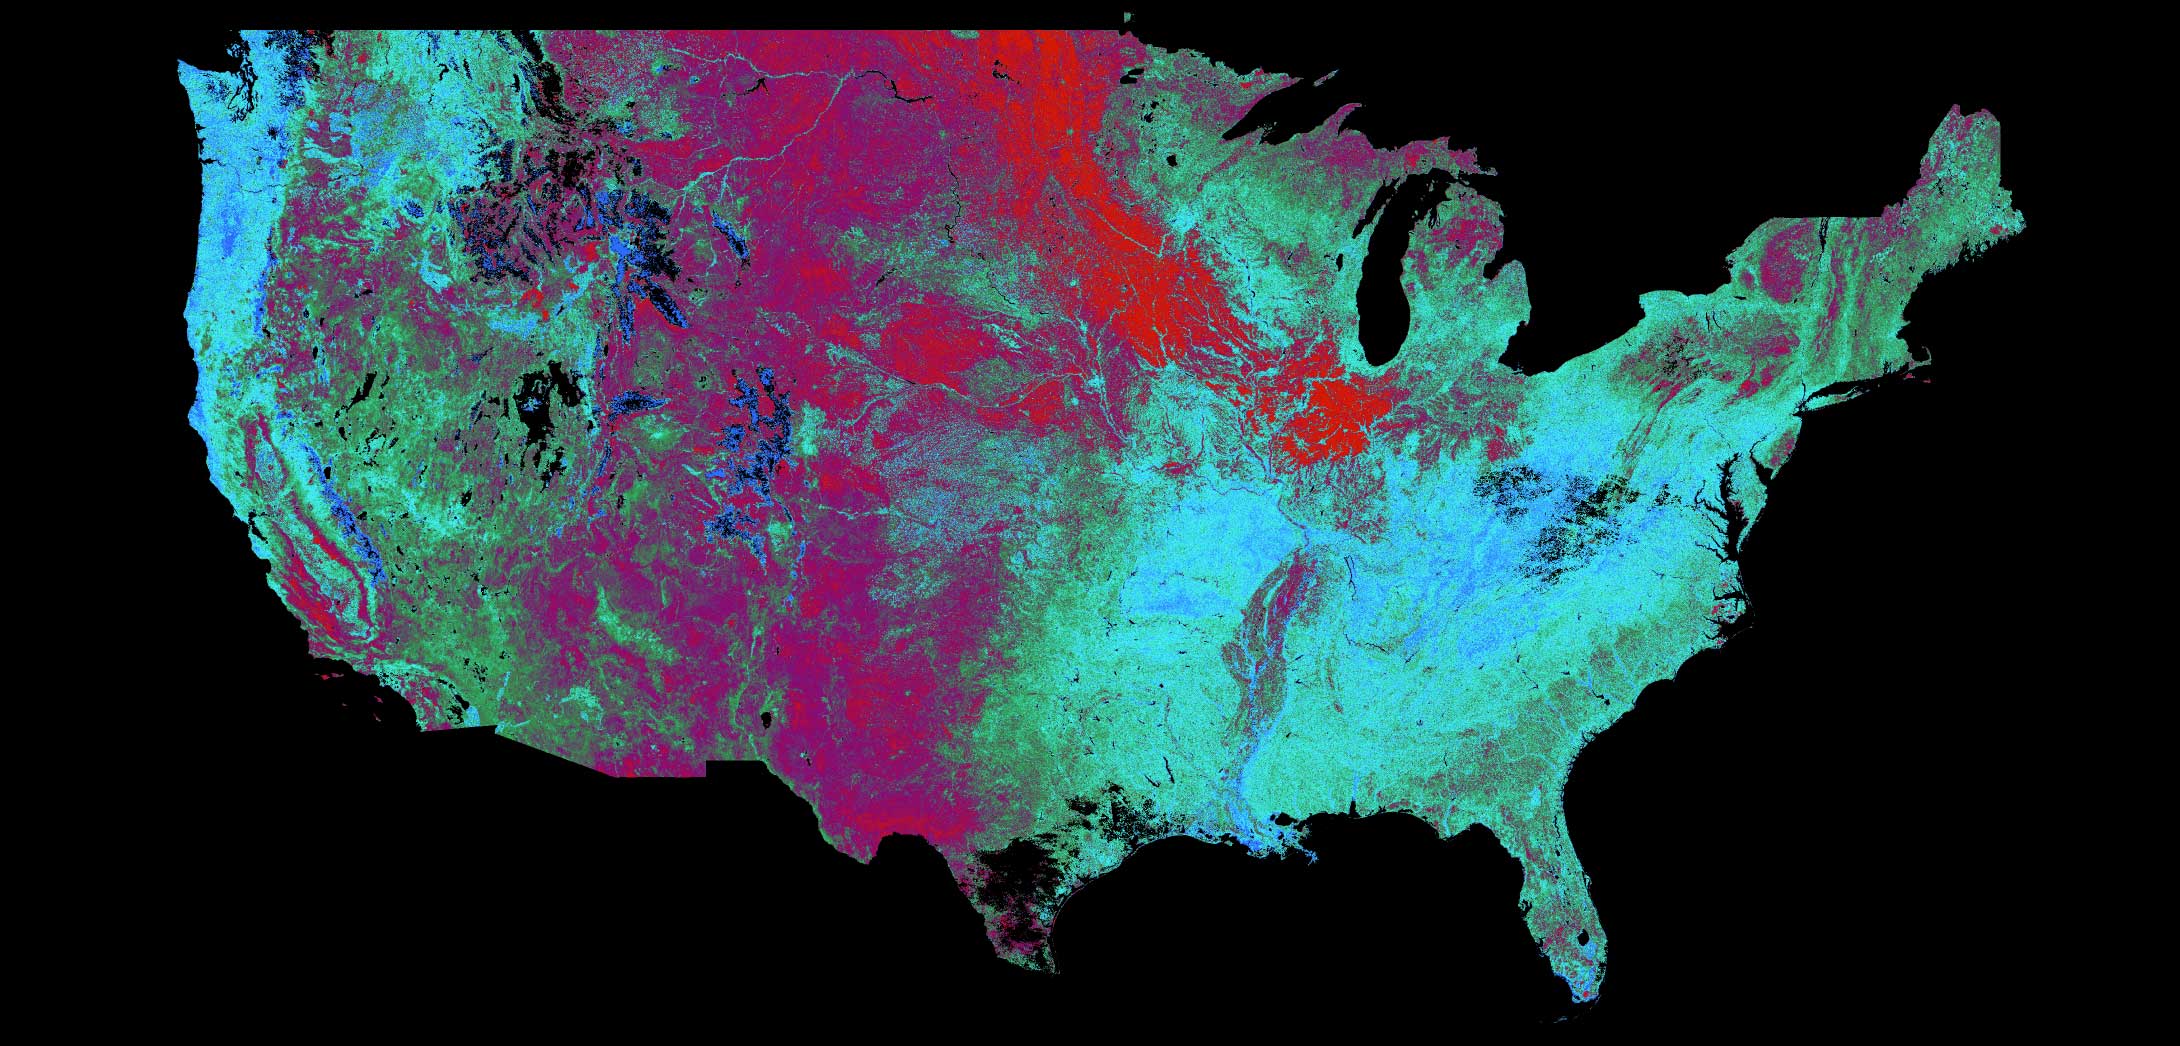
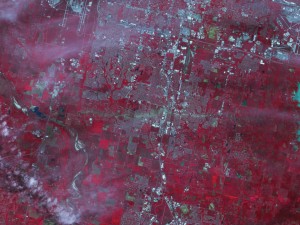
FIGURE 2.
Image of the U.S. taken Summer 2017 is a MODIS-based NDWI (Normalized Difference Water Index) image. Blue and green indicate wet areas; purple is less wet; red indicates dry areas.
Tellus does not make use of the latest crop of cubesats from private companies, preferring to rely on large, legacy, government-built and -operated satellites. “At TellusLabs, we are all scientists,” says Malizia. “These instruments were built to do science. They are very well calibrated, they have a long history, there is a large community of scientists and users that have been ironing out all the kinks on them. They are science-grade instruments, so we are very comfortable using them.”
However, the company considers itself sensor-agnostic and is exploring partnerships with other data sources. “Our aim is to use the right tool for the job,” says Malizia. Their customers, he points out, don’t necessarily care about, say, the return rate of Sentinel-2. Rather, they just want to know how their fields are doing, what they can expect out of this year’s crop, and whether there is anything about which they need to worry.

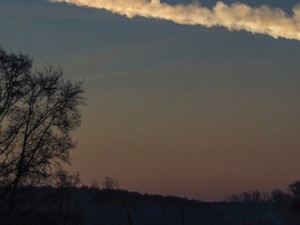
FIGURE 3.
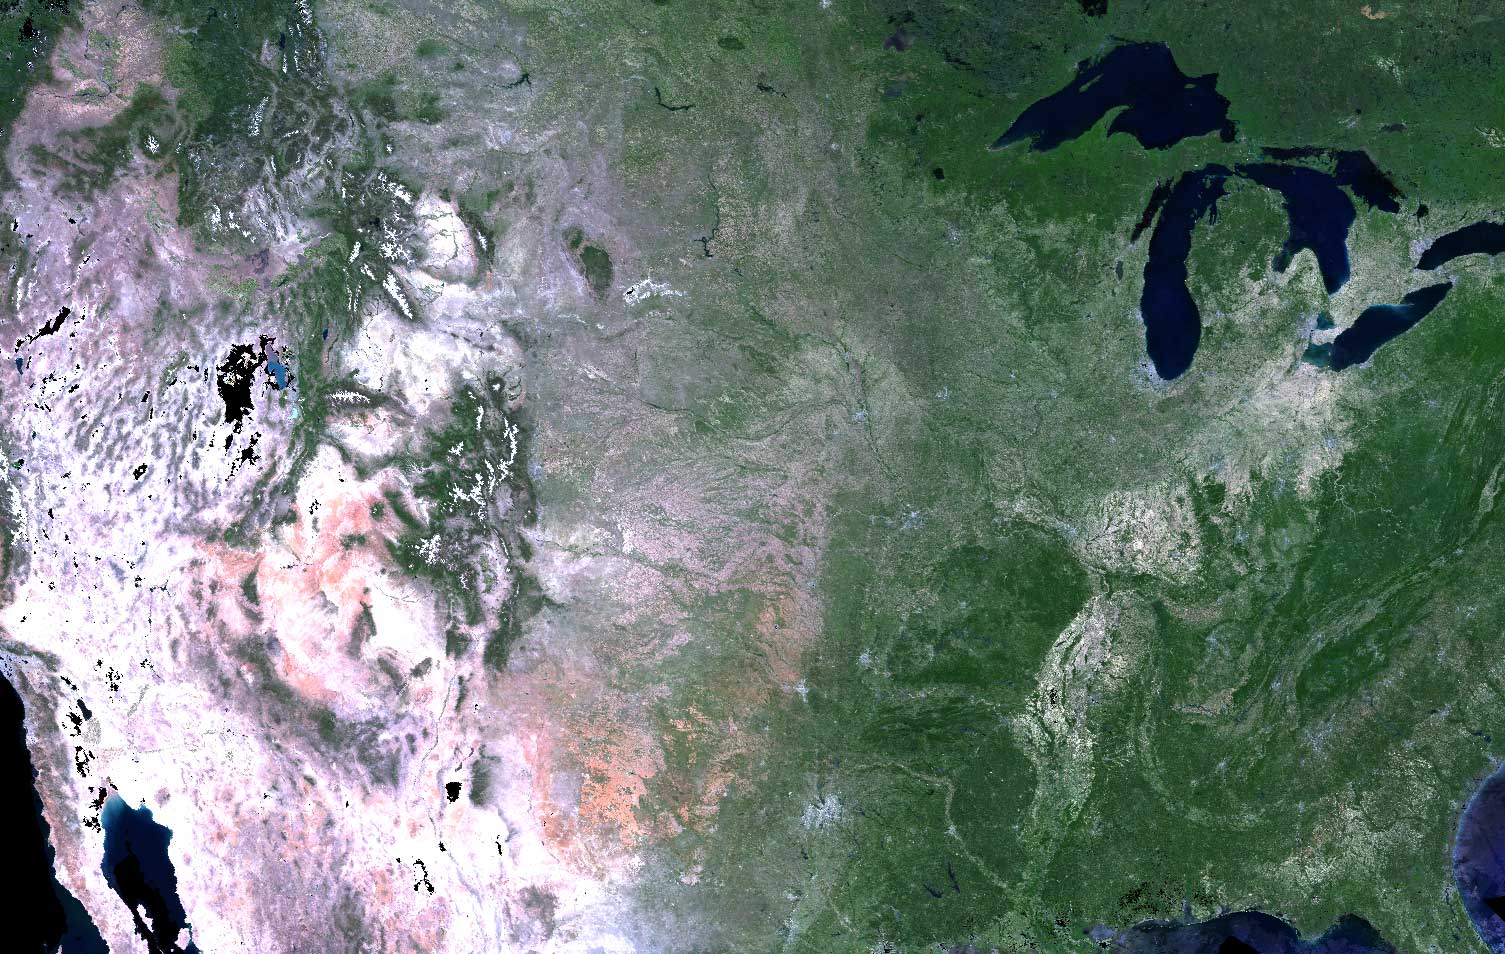
FIGURES 3-4.
MODIS true color images of the central United States. Figure 3 was in Winter with snow and lack of vegetation is visible along the corn belt. Figure 4 was in early Summer, at the beginning of the “greening-up” phase.
ANALYTICS
TellusLabs is building out Kernel to expand its scope and depth, the number of countries and crops it covers, and its global- and field-scale integration. “We want to fill out the suite of product components that we are offering to our customers,” Malizia says. “We want to be the source for remote sensing analytics for agriculture across the globe. So, everything that we are doing is in the service of that goal.”
The company makes available to its customers all the data that it uses for its modeling and that go into its model feature construction, so that they can query it. However, it does not enable them yet to use some of its tools like Web services. “You cannot feed some of your own data and get a whole host of data back,” says Malizia. “We are offering up the data that we think is most valuable and just seeing how people are using it.”
However, he adds, “in the not too distant future,” the company might enable customers to upload their own spatial data, such as their fields or other geographies that they want to analyze, and answer their queries.
The types of analytics that TellusLabs does runs the gamut, from correcting raw satellite imagery to analyzing it to summarizing images over specific geographies, then doing more analyses on top of that.
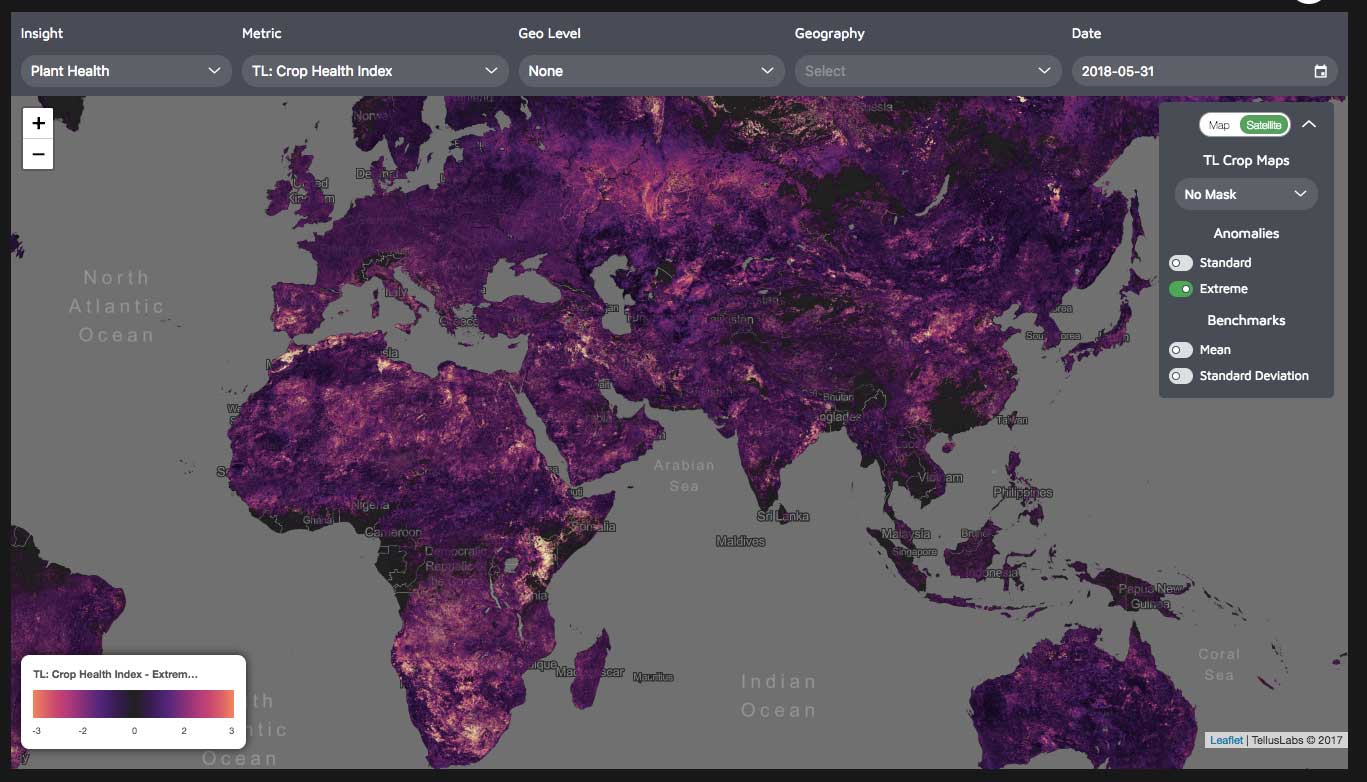
FIGURE 5.
Image from the TellusLabs Kernel product, showing an Extreme Anomalies layer applied to the TellusLabs proprietary Crop Health Index mask.
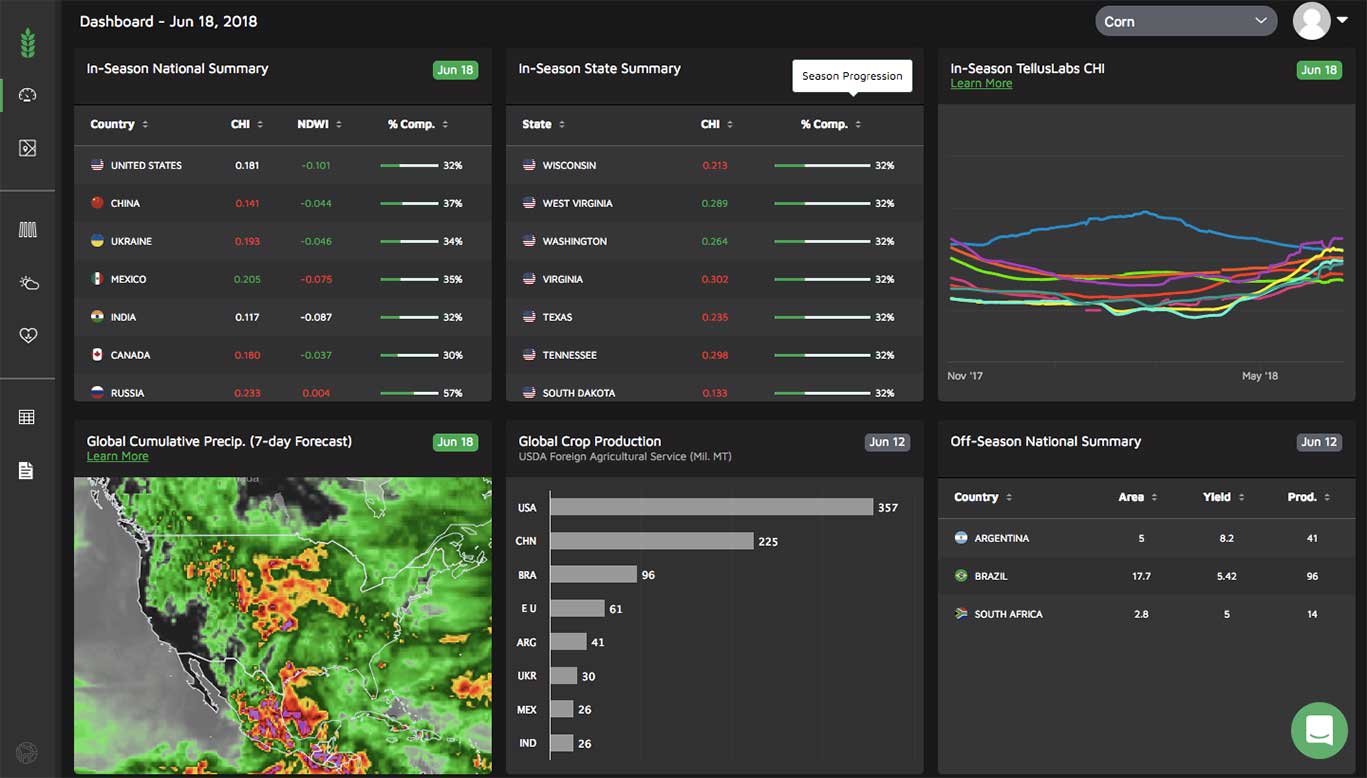
FIGURE 6.
Image of the Kernel dashboard, showing a variety of crop health insights across the globe.
MODELING
A particularly interesting area of TellusLabs’ work with its field scale partners is to identify certain phenomena on the ground, such as diseases and water stress, and to understand the different qualities of the crops that are being grown, such as grains or oil seeds. “We have done a fair bit of modeling on that,” says Malizia.
In agriculture, location matters; however, mapping crops correctly is very labor-intensive. “One of the things that we are doing is understanding where the crops are being grown in season and what crops they are,” says Malizia. “That allows for a fair bit of innovation on the modeling side.”
For yield modeling, TellusLabs uses several modeling and forecasting techniques, ranging from standard linear models to neural networks. “Ultimately, what drives the decision of what we are going to use, in practice, is how our models perform historically, in a given setting,” Malizia explains. “We think that there is a lot of value in the feature engineering, so, we are building features that we think are going to be valuable, as opposed to just feeding in raw data. We try to be deliberate about what we’re putting into the models.”
StreetLight Data
INDUSTRY NEEDS

Laura Schewel,
CEO and founder
of Streetlight Data
“We are the first and only analytics company that allows the transportation industry to put big data to work,” says Schewel. “We combine access to the best data resources that describe mobility behavior with the software to make it useful.”
The transportation industry – which includes state and regional public transportation agencies, the transportation consulting and engineering sector, and the new and emerging private transportation sector, including Uber, Lyft, and bike sharing companies – has a high need for geospatial big data. However, Schewel argues, it does not make sense to develop deep data science and geoanalytics capabilities in every government agency or engineering firm. Instead, her company developed software to make it easy for transportation professionals to use big data to answer their most frequent questions, regardless of their degree of geospatial expertise.
Dedicated spatial sensors, which are increasingly common, are fine for some applications. However, Schewel points out, they duplicate the capabilities of the billions of dedicated geospatial sensors that are already in everyone’s pocket, namely cell phones, soon to be supplemented by connected car technologies. “So, we targeted ways to get our hands on that type of data, by doing deals with people who are already collecting it for their own purposes. These include people who make smartphone apps to collect anonymous location data and connected cars and connected trucks companies and fleet management companies that collect data about vehicle behavior.” Her company then pulls trillions of those points into its system to develop detailed analytics about the mobility behavior of large aggregate groups. Its clients access these analytics by logging into StreetLight Data’s website and using them to make decisions about transportation.
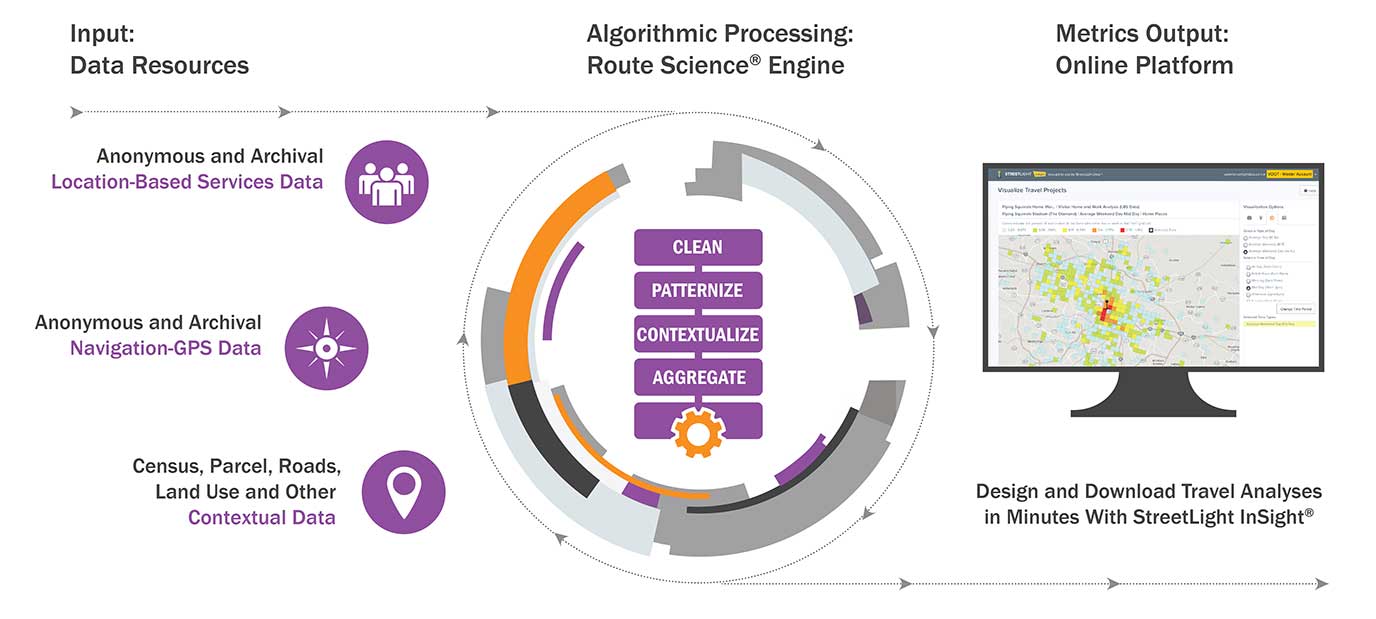
FIGURE 7.
Diagram of StreetLight Data’s locational and geospatial data inputs, algorithmic processing steps, and online platform for querying processed data.
BUSINESS MODEL
StreetLight Data’s business model is based on two propositions, Schewel says. The first one is that trans- portation decision making and planning has historically been based on almost no data, even for such billion-dollar decisions as where to expand a highway. “People were basing major decisions on assumptions or on a survey from nine years earlier that covered .003 percent of the population affected.” Therefore, her company endeavors to provide “much bigger, better, and more robust and expansive data options from big spatial data.”
The second proposition is that the marginal cost of running each additional query in the cloud is virtually zero. Therefore, transportation planners and decision makers who were previously inhibited by the cost of analyzing conditions on each road segment can now feel free to analyze and compare conditions on thousands of roads. For example, Schewel says, clients are now searching for the best route for a bus lane by first scanning every road in a city to find where bus lanes are most needed. The “ubiquitous availability of geospatial data is changing how transportation decision making flows.”
“Machine learning in transportation is ‘a little overhyped’ because it requires having a truth dataset from which your machine learns. In transportation, there is almost no truth data.”
-Laura Schewel, StreetLight Data
StreetLight Data licenses data from a variety of sources who are creating them for their own purposes, then combines them with more conventional sources of spatial data to create a SaaS business model. The company’s clients subscribe to its online portal and can run analytics within it. Its largest users are Departments of Transportation – including those of Virginia, Ohio, Minnesota, and New York City – as well as engineering firms and other private sector companies.
ANALYTICS
“We take very messy data that describes the mobility behavior of more than 70 million devices and we turn it into useful analytics that transportation professionals care about,” Schewel says. To protect pri- vacy, her company only generates aggregate analytics. Examples include:
* the percentage of people driving across the Bay Bridge who end up in every neighborhood in San Francisco;
* where the greatest number of short-distance trips take place in New York City;
* where tourists hang out in L.A. between 3PM and 8PM on a typical weekday;
* in what neighborhoods people who cross the border in Texas end up and how that differs between commercial trucks and personal vehicles.
“These are all types of analytics that describe mobility and that people who are planning the transportation system care about,” Schewel says. The types of questions they are trying to answer vary from huge, such as where to route a multimillion dollar highway, to very small, such as “whether the stop light should go on 4th Street or 5th Street, or the toll price should be $2.50 or $2.75.”
FUNCTIONALITIES
Users cannot write generic queries against StreetLight Data’s data, but they can create their own queries from a menu of queries that the company provides. “That self-customizability is important to making it useful,” Schewel says. For example, they can analyze transportation behaviors in neighborhoods for which they uploaded shapefiles. “It is not a generic spatial platform; it is very particular for transportation planning.”
StreetLight Data inputs data and outputs metrics, such as an origin-destination matrix for the entire state of California. “A metric is an aggregate, processed, value-added data product,” Schewel explains. Customers can visualize their metrics in the company’s portal as maps and charts or download them in various formats, such as csv, that they can then import into their own system. The company also provides an API that allows users to create metrics and pull them directly into whichever software they use, or deal with them via the user interface.
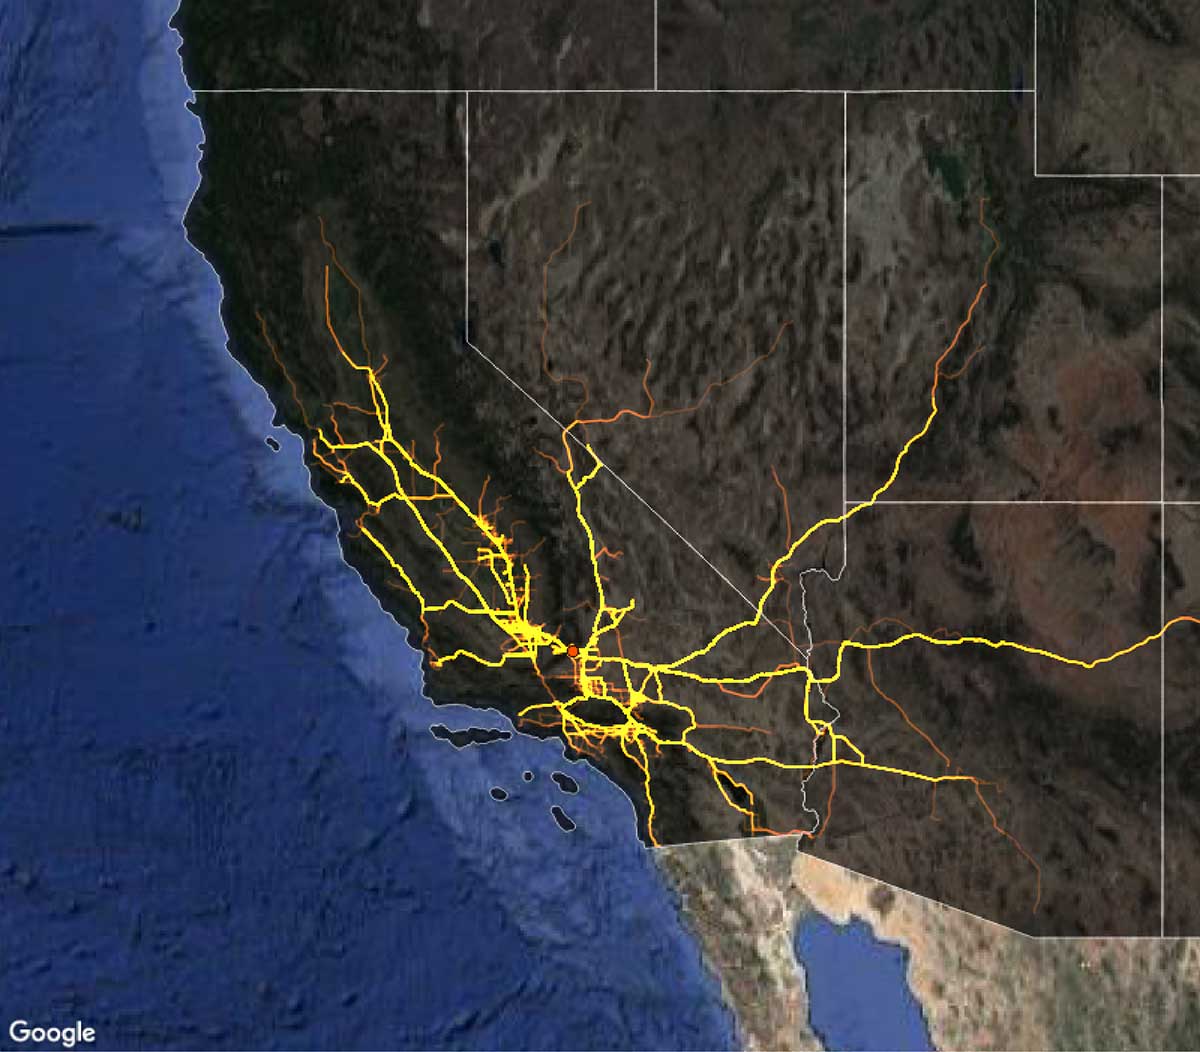
FIGURE 8.
This image visualizes the routes of heavy-duty commercial trucks leaving the Port of Los Angeles-Long Beach, courtesy of StreetLight Data.
DATA SOURCES
The company obtains all its big data, such as those that describe mobility behaviors, from commercial partners, which crowdsource it. “Our whole business model is based on the explosion of crowdsourced data,” Schewel says. “We wouldn’t exist if that did not exist. It is facilitated by the LBS aggregation industry, which aggregates crowdsourced data.”
The company looks for data that is complete with regards to transportation behavior. “I’d rather have a more complete description of a transportation behavior, such as a trip, than a high number of partial pieces of transportation data. Now we are also looking for partnerships that can give us data on special types of transportation, such as data that is specific to walking, biking, or bus riding.”
MACHINE LEARNING
According to Schewel, machine learning in transportation is “a little overhyped” because it requires having a truth dataset from which your machine learns. “In transportation,” she points out, “there is almost no truth data.” Therefore, for most of its core analytics, StreetLight Data relies on heuristic, decision tree-style algorithms. “However, for certain types of things, such as mode inference (whether someone is biking or walking) we do use machine learning. So, we mix and match the right techniques, depending on the question at hand and the calibration data that is available.”
The name StreetLight Data is a metaphor. The company brings real-world travel patterns to light. Just as streetlights illuminate our roadways at night, StreetLight Data creates analytics that shine a light on mobility behavior.
CONCLUSIONS
Whether analyzing global trends in food production or local traffic patterns, geospatial analytics continues to evolve rapidly, taking advantage of the explosion in crowdsourced and satellite data, ever-faster computer processing, and the latest machine learning techniques. The next quantum leap will probably be due to the proliferation of data from Internet of Things (IOT) devices, with applications from self-driving cars to kitchen appliances. Buckle up and relax, as your refrigerator gives your car the groceries shopping list.