MATTEO LUCCIO / CONTRIBUTOR / PALE BLUE DOT LLC / WWW.PALEBLUEDOTLLC.COM
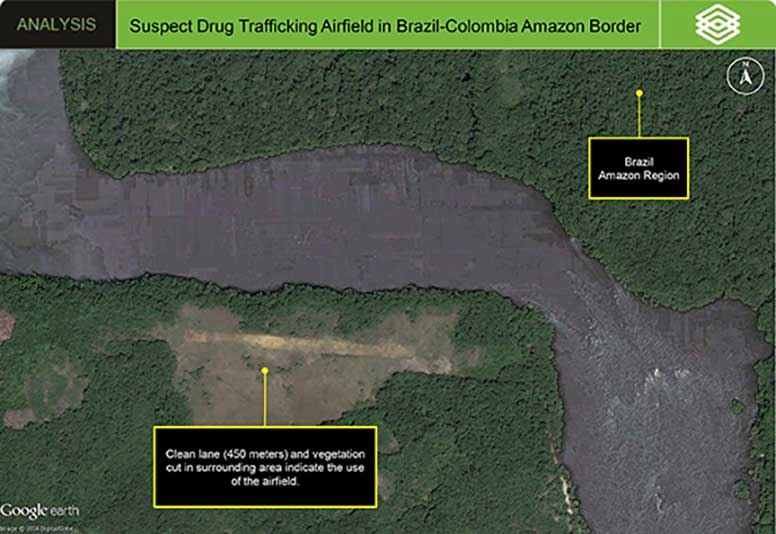
FIGURE 1. Suspect Drug Traf cking Air eld in Brazil-Colombia Amazon Border – Drug traf cking is an illegal activity in Brazil and is responsible for a large number of interconnected crimes, e.g., murders, robbery, and weapons smuggling. Although Brazil itself is not a producer of drugs, it is surrounded by countries that are the biggest producers in the world, such as Colombia, which led to increases of Brazilian internal drugs consumption and criminal indices over the past years. Courtesy AllSource Analysis. Satellite image courtesy DigitalGlobe.
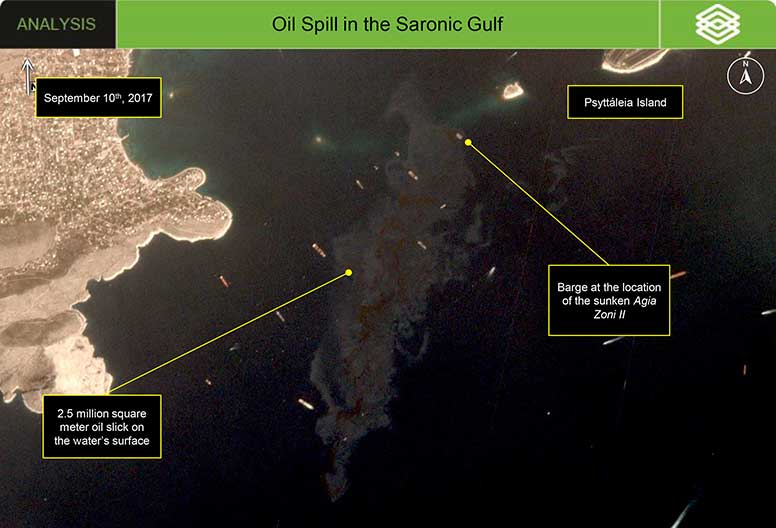
FIGURE 2. Oil Spill in the Saronic Gulf – On early Sunday morning, September 10th, 2017, the oil tanker Agia Zoni II sank in the waters between Piraeus and the island of Salamis. The vessel was carrying approximately 2,200 metric tons of fuel oil and several hundred tons of marine gas oil, which reportedly leaked from the hull into the Saronic Gulf near Atalánti and Psyttáleia Islands upon sinking. Courtesy AllSource Analysis. Satellite image courtesy Planet.
The field of Earth Observation (EO) has seen two big changes in recent years: first, the massive increase in the number and variety of space-based sensors and, hence, the proportional increase in the amount and refresh rate (cadence) of EO data and falling prices for them; second, the shift by EO companies from selling pixels to selling finished intelligence products that answer specific questions—in other words, from data to analytics. This first article in this new series presents the perspectives of two long-time players in this industry:
Chuck Herring, CEO and Co-Founder of AllSource Analysis; Marc Fagan, CEO of Earth Observation Systems (EOS) Data Analytics.ORIGINS
Herring grew up hearing about all kinds of space missions. His father was a senior leader at Ball Aerospace for about 25 years and his older brother has been at Lockheed-Martin for almost 30 years. When Ball Aerospace became the major owner of EarthWatch, the predecessor to DigitalGlobe, his father was the founding CEO. “I was working at IBM. He brought me over for lunch and I was very interested, so I switched to EarthWatch.” His passion for the field has kept him in it since. “It is exciting, interesting, and fun to be involved in the birth of a new industry and watch it take off.”
In his early days at DigitalGlobe, as Herring understood his customers’ questions and problems, he began to think of what later became AllSource Analysis. While many of his customers were savvy about the technology, others did not fully understand it. He and his colleagues began using subject matter experts and image and geospatial analysts to extract information out of the imagery, so as to provide their customers with answers, rather than just pixels. The savvy customers – generally, governments and large corporations that were already using aerial imagery – often needed help extracting the information that was most relevant to them, especially in real time. Toward the end of his time at DigitalGlobe, Herring and a few of his colleagues including Stephen Wood, formed a group called the Analysis Center, then decided to found AllSource Analysis outside of DigitalGlobe, because they felt that they needed to be “agile and small” and able to adjust their offering and their business model to their customers’ needs. Stephen was a co-founder who has stepped away from day to day, and is still involved and on the board.
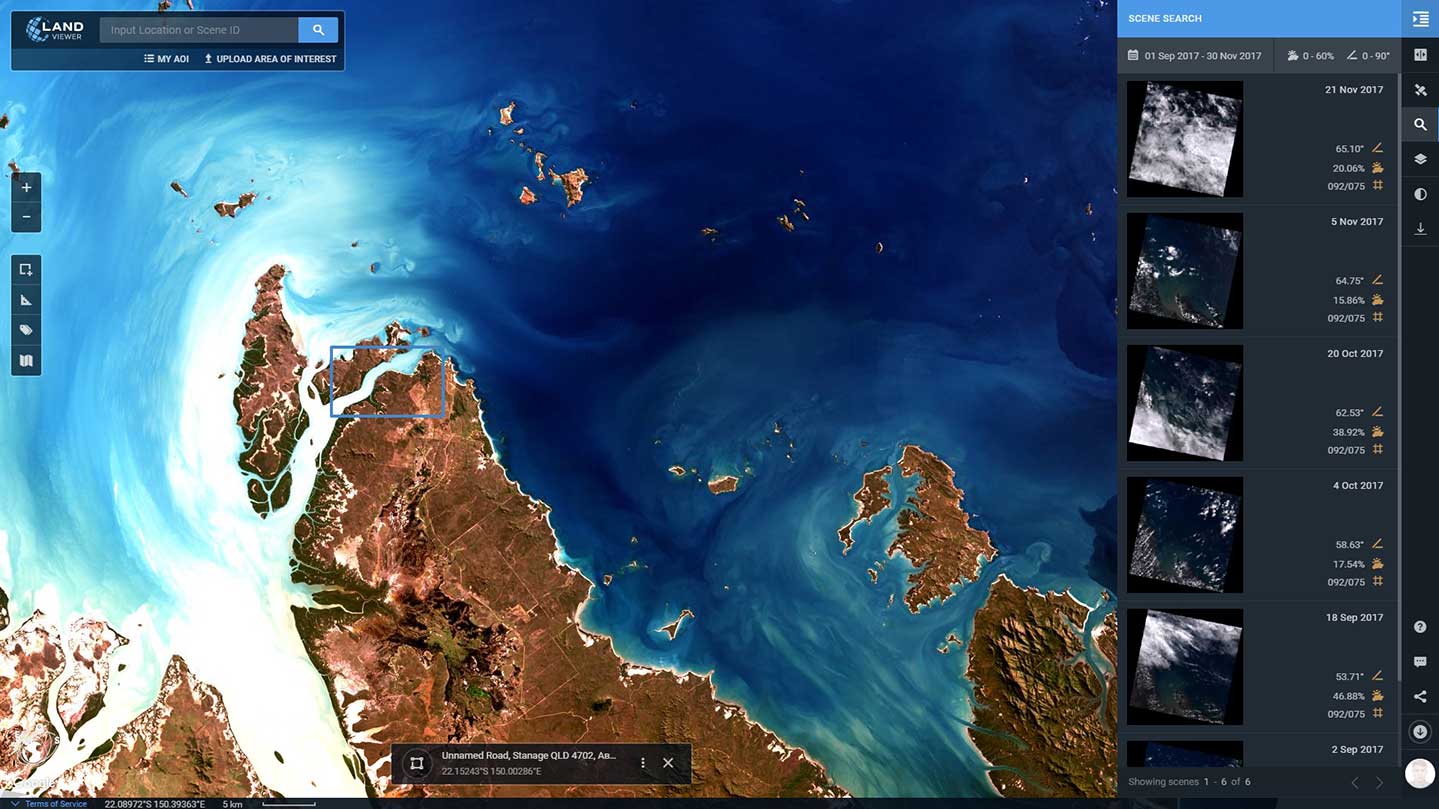
FIGURE 3. LandViewer is an on-the- fly imagery browser that allows the public to explore potential scientific, social and business applications of earth observation data, in this case, Landsat 8 imagery of Stanage, Queensland, Australia.
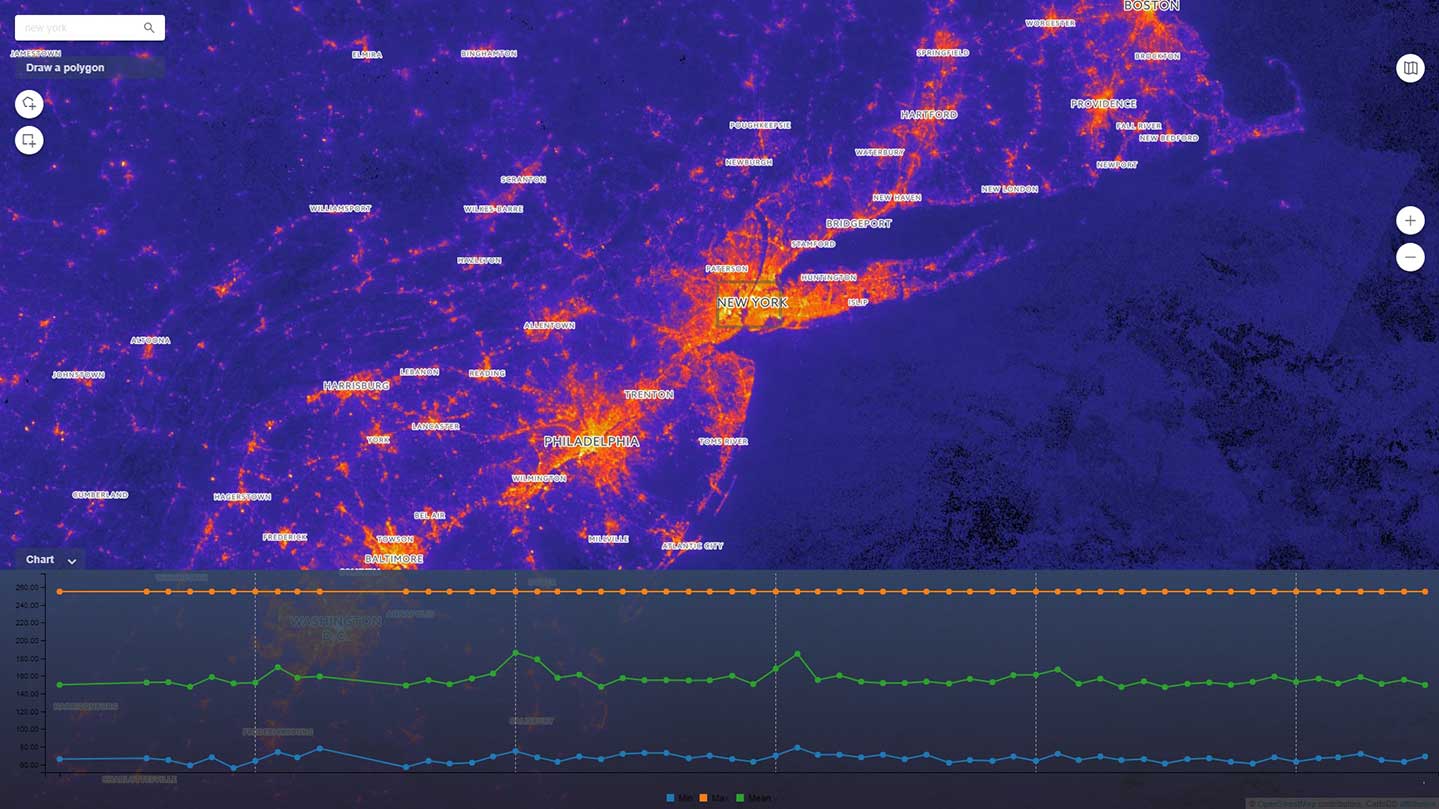
FIGURE 4. GDP Analysis – Night lights change detection (worldwide) for gross domestic product (GDP) analyses utilizing NOAA Visible Infrared Imaging Radiometer Suite (VIIRS) of New York and Philadelphia regions, U.S.A.
Before joining EOS Data Analytics, Fagan was part of another venture-backed startup that had an exclusive partnership with Google, which was then launching Google Maps Engine, an imagery analytics program. “We were investigating the opportunity for commercial applications of Earth Engine analytics,” he recalls. “Part of the consideration included identifying go-to-market strategies, and the technical and product requirements for commercialization.” Jointly, the two companies developed a series of pilots with such companies as Pacific Gas & Electric, Chevron, and water utilities. Ultimately, Google deprecated Google Maps Engine, which was to be the vehicle for the commercial implementation of Google Earth Engine. “By this time however, we understood the potential and value of EO imagery analytics for commercial as well as non-commercial applications.”
EOS Data Analytics is backed by Noosphere Ventures, a Silicon Valley, California-based VC managed by Max Polyakov.
Noosphere, Fagan recalls, approached him to start a company to develop a cloud-based EO analytics platform, utilizing software engineers and EO research scientists largely resident in Ukraine. “I spent a fair amount of time investigating the talent of the team there and the opportunity, and ultimately decided that the talent was excellent and started the company as the CEO in 2015.” Presently, Fagan says, EOS has 103 employees, including four professors, nine additional PhDs, and 60 people with master’s degrees in mathematics, EO, analytics, and GIS. The management and product management teams are in Menlo Park, California, and the engineers and scientists are in three cities in Ukraine: Dnipro, Kharkiv, and Kiev.
CHANGES IN THE EO DATA MARKET
“When the high-res commercial imagery first started, you had just a couple of satellites from DigitalGlobe and Space Imaging,” Herring recalls.
Now, in addition to the enormous amount of imagery being collected by DigitalGlobe (and all the predecessors that are now part of DigitalGlobe), there are new players, such as the European Space Agency, Planet, and UrtheCast, and many others keep emerging, including some that are talking about launching SAR satellites. “You are looking at spectral enhancements, you are looking at getting into radar.”
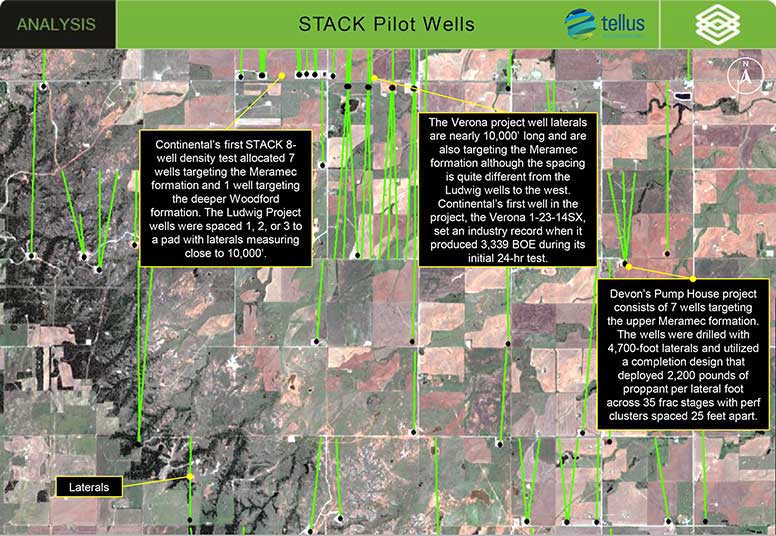
FIGURE 5. STACK Pilot Well Programs in Oklahoma – New eld Exploration Company announced the discovery of Oklahoma’s STACK play in November of 2013. The Sooner Trend Anadarko Basin Canadian and King sher counties (STACK) play was so named due to the stacked nature of the play’s production zones. Courtesy AllSource Analysis. Satellite image courtesy DigitalGlobe.
Most commercial customers, however, are not able to fully understand and interpret these data,Herring points out. Therefore, in addition to the technology, the EO industry provides expertise, including AI and machine learning, to expedite getting the answers that their customers require. Increasingly, government customers want to acquire finished intelligence, as opposed to just pixels. “There are many different companies solving many different imagery and geospatial problems,” Herring says. Nevertheless, the more savvy customers often also want the source imagery, to use for basemap purposes.
Additionally, Fagan points out, the advent of open source and very inexpensive methods to convert imagery into point clouds using photogrammetry has given a new boost to aerial imaging, including UAVs. One use case he cites is the use of aircraft and UAVs for the detection of structural changes along gas transmission pipelines for safety measures. Nadir high resolution satellite imagery, he explains, was unable to properly register multiple image sets and made it difficult to correct for distortion along sloped surfaces. These issues, he says, made it impossible to detect changes of less than 300 square feet. Now, by converting digital imagery sets using photogrammetry, it is possible to develop very high-resolution point clouds and apply change detection methods that have nearly perfect registration between images and obviate the issue of the distortion of sloped surfaces, Fagan says. This, he adds, can now be done at very competitive pricing and with verifiable accuracy.
BUSINESS MODELS
AllSource Analysis’ business model, Herring says, is a combination of selling imagery and providing more automated analytics. “So, being able to do large areas, across continents, across regions, doing change detection, object dentification, those types of things…” Their analytic services range from classic use cases, such as counting cars in parking lots to monitor sales, to volumetric analyses of oil facilities.
“Also, DigitalGlobe and Planet are building many of those tools for their partners.” This “first phase analytics,” Herring explains, can accelerate what his ana- lysts do. AllSource Analysis has created a network of analysts and, early on, signed a strategic partnership with BAE Systems’ GXP group, which has a secure, cloud-based platform that analysts can use from anywhere. “It is an amazing platform that is essentially that advanced tool kit that an expert analyst needs to use.”
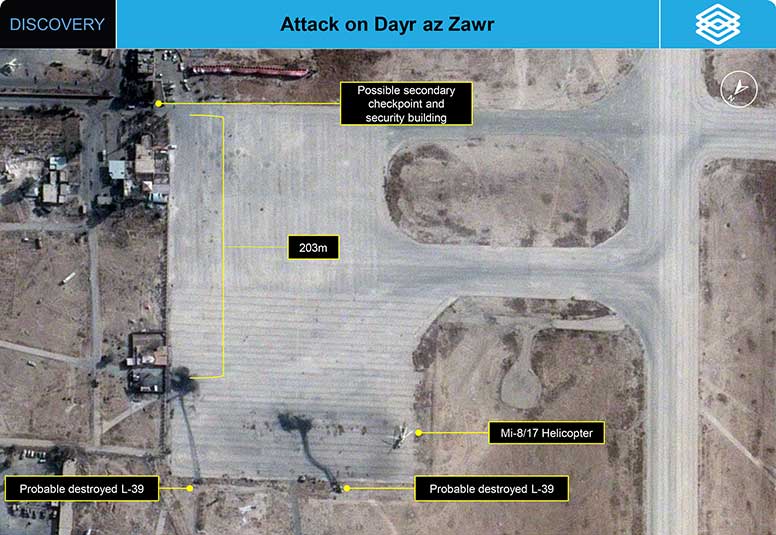
FIGURE 6. Attack on Dayr az Zawr Airbase – Analysis of GEOINT reveals that the in ltra- tors were able to travel approxi- mately 600 meters through checkpoints, security fences, and defensive fighting positions to reach L-39 aircraft on the main operational apron. Courtesy AllSource Analysis. Satellite image courtesy Airbus.
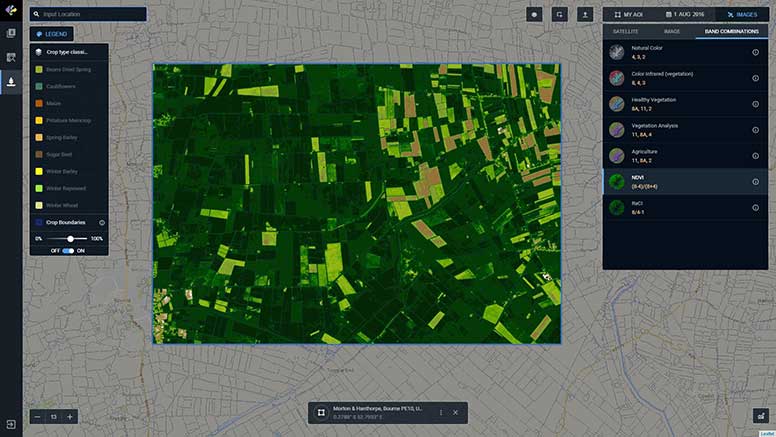
FIGURE 7. Crop Monitoring – Crop production monitoring and yield forecast- ing utilizing neural nets, high-cadence satellite imagery, and InSAR (Interferometric Synthetic Aperture Radar) with ESA’s Sentinel 1, including spectral health monitoring indices relevant to agri- culture, including grain trading and crop insurance, in Bourne, U.K.
Some of the analysts that AllSource Analysis employs were trained in the intelligence community or academia and are now between jobs or retired. “This is something for which they have a passion.” Additionally, they have an expertise in a particular area, such as Middle Eastern security, Asian economic development, or energy. Many of the more savvy commercial customers, such as energy companies, have in- house mapping capabilities but may lack the capability to view and analyze imagery. “We have the software, the content, and the experts,” Herring says. “We provide the finished intelligence product. We take all that complexity away and we can do it in a very cost-effective way, because we do not have a building filled with a thousand full-time analysts. We are able to scale and bring on analysts as we bring on customers.”
EOS’ core technology is EOS Engine, a platform-as-a-service for building, developing, presenting, and imaging processing and analytics, Fagan says. It includes a “work bench,” consisting of workflow, sequential processing steps, business rules, and a suite of GIS functions and features, which allows EOS to rapidly configure use cases by simply pointing to its repository of datasets in the cloud, he says. Once configured, the use case automatically creates, accesses, and processes EO data. “Our goal is to be the market-leading EO analytics platform in any and all industry verticals.” EOS plans to sell this platform as an OEM product to customers that already have relationships with end users.
EOS has also developed a free cloud-based platform, called “LandViewer” that enables non-EO experts to peruse datasets and derive spectral indices, such as NDVI, NDWI, and atmospheric penetration. The company is currently working, in partnership with Amazon, with Landsat, MODIS, and Sentinel 2 data and plans to soon add data from Sentinel 1 and NASA’s Suomi National Polar-orbiting Partnership (NPP), Fagan says.
It recently released a premium version of LandViewer that provides more expert analytics and will soon provide commercial datasets from additional satellites as well as from aerial imagery providers. The company has developed proprietary methods of automatically indexing, stitching, tiling, and mosaicking raw imagery scenes and is providing these services to multiple satellite and aerial data providers, Fagan says. LandViewer, by educating potential end users as to new EO datasets, coupled with derivative data and analytics, has been a great lead source for all of OES’s products, he adds.
Pricing of EOS Engine, which is primarily focused on enterprise applications, is based on per square kilometer by use case, because each use case consists of a different combination of processing and data type, Fagan explains. With LandViewer products, EOS charges a base monthly price for the analytics and open source datasets and will add commercial datasets and more sophisticated analytics for a flat monthly fee.
AI AND MACHINE LEARNING
While AllSource Analysis is not building AI or machine learning, it is leveraging its partners’ resources in those fields. “Not only can our analysts do the Phase 2 and Phase 3 finished analytic product, they can also help those AI machine learning developments refine their capabilities, essentially train and help,” says Herring. While companies such as DigitalGlobe, Orbital Insight, and Planet are automating image analysis, AllSource Analysis is focused on the human imagery intelligence experts.
EOS has a large staff of EO scientists with expertise in the traditional mathematics of pixel analysis, Fagan says. However, since its founding, EOS has largely converted to AI methods primarily using convolutional neural networks, which, he says, greatly extends its range of capabilities and is required by the land mass covered by its analytics. Its methods include land cover classification, feature recognition, and InSAR. “We have extensive ‘training’ programs and continue to improve on our results and the more refined indexing of results.”
As examples, Fagan cites analyses of tiered water pricing rates by classifying ground cover and applying evapotranspiration rates to identify target water con- sumption rates by properties; a crop production monitoring analytic utilizing SAR data to discern the production rate of crops by type; and multiple applications replacing nadir imagery sets with rapid and less expensive photogrammetry processing of point clouds. Use cases also include asset management and construction monitoring and the identification of the lifecycle stage of upstream oil and gas wellheads, based on identifying the types of equipment present. “This is a very exact indicator of the production rates of oil and gas for the commodities and futures markets that provides such insights way before any other methods in the industry,” Fagan says. EOS also applies the same methodologies to LIDAR datasets, he adds.
PARTNERSHIPS
“There is a huge ecosystem out there built on geo-spatial analytics and intelligence,” Herring points out. For example, DigitalGlobe continues to build out its capabilities with regards to high-res and very high-res imagery, Planet is combining its “doves” with the SkySat constellation of seven satellites that it acquired from Google, other companies are deploying radar satellites, and still many more satellites are coming. To be true to its name, AllSource Analysis partners with several imaging companies and technology providers “because that accelerates what our analysts can do,” Herring says. The company also started partnerships with companies that provide real-time alerting such as Stratfor and PlanetRisk. This allows their customers to geofence an area – say, where a company executive is traveling – and get alerts about events in that area that might raise security concerns before seeing them on the news, as well as additional relevant information.
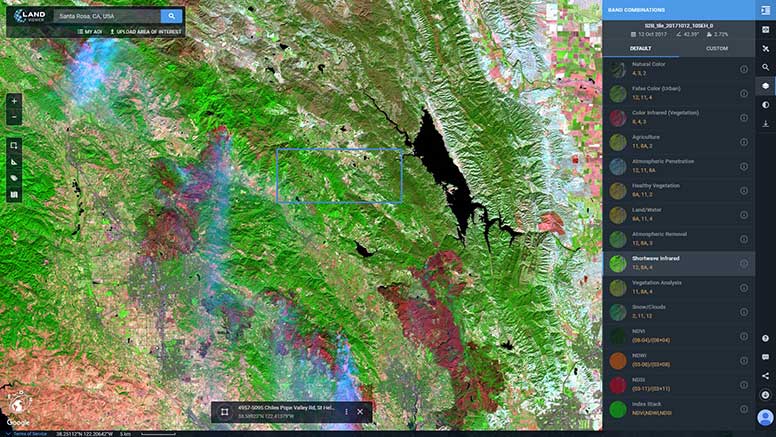
FIGURE 8. LandViewer showing on-the-fly shortwave infrared spectral analysis with Sentinel 2 imagery of St. Helena, California, U.S.A.
FIGURE 9. WaterCloud – Ground cover classification utilizing convolutional neural networks (AI) and aerial imagery and evapotranspiration rates for water conservation analytics in N. California, U.S.A.
AllSource Analysis has a “symbiotic customer relationship” with Stratfor, which specializes in geopolitical intelligence and has experts around the world watching issues from elections to terrorism. “They don’t have an imagery intelligence capability, nor, because of our partnership, do they want to build that internally. So, they are telling us what they are working on and can request intelligence from us.” The company is also developing partnerships with companies that are doing ground intelligence in areas of the world where it is harder to get ground intelligence due to lack of security. “They have a product that is complemented by our product.”
Among EOS’s partners, Fagan cites Airbus, DigitalGlobe, Planet, TerrAvion, and DroneBase. “We are also in negotiations with satellite entities from China, Kazakhstan, the UAE, and Korea and we continue to work diligently with Amazon and their partners for open source datasets such as NOAA, NASA, and the European Space Agency.”
CUSTOMERS AND USE CASES
Most of AllSource Analysis’ current customers are in the fields of government and commercial security, energy, and finance, though Herring also mentions Uber and Lyft. While the applications across these fields are generally of the same type, the company’s success hinges on the ability of its subject matter experts to answer its customers’ specialized needs and questions. Unlike companies that do very project-based analytics, as consultants, Herring explains, AllSource Analytics is putting together a subscription program, with three levels of product: a 5-10 page “discovery” report, a 10-20 page “analysis” report, and an “insight” report of more than 20 pages. The exact mix and frequency of these reports is customized to each customer’s needs. “We are priced in a way that makes it very easy to understand,” Herring says. “It makes it predictable for the customer. We are not selling them a multi-million dollar project.”
“We are bringing a new economy for the analysts to address the human in the loop of spatial analytics.” As an example of AllSource Analysis’ work, Herring cites research for the U.S. government and U.S.-friendly foreign governments on geopolitical issues that may affect their national security, such as refugees, food security, or oil. “This is all open source, it is commercial, it is the same as what we talked about when imagery first started coming on line. It is stuff that we can help them with that they can share across agencies and with other governments.”
Another example he cites is corporate security. For example, an energy company or a large manufacturing company that has multi-billion dollar facilities in dangerous regions throughout the world, where things can change very quickly, wants to understand its potential vulnerabilities or threats in real time. A third example concerns competitive intelligence, for example in the energy industry, in which a company might want to know not just what the industry volume is but what quarterly profits a competitor is likely to report.
EOS, Fagan says, has developed a large knowledge base regarding the numerous EO data types that, coupled with the appropriate analytics methods, support the myriad of use cases across industries. “Our development road map,” he says, “has been dictated by first identifying from industry experts the most valuable use cases and testing and verifying the correct data type and analytics to support those use cases.”
“One of the tenets of our company is being data agnostic,” Fagan says. Companies that rely on just one or a few sensors, typically because those are the ones they own, need to develop analytical capabilities to augment the value of their data, he explains. However, the myriad of use cases in both the commercial and nonprofit sectors require many different sensor types, with different resolution, spectral bands, cadence, and costs. “Presently, EOS is doing an awful lot with SAR, primarily with ESA’s Sentinel 1A and Sentinel 1B, but also with Airbus’s TerraSAR products.”
Another use case that demonstrates the need for being agnostic with regards to data sources, Fagan says, is the detection and modeling of change in the signature of night lights worldwide as a proxy for changes in GDP, a project for which EOS utilizes the NPP sensors. Another example is the identification of the production rates of specialized refineries, called crackers, using SWIR (shortwave infrared) to detect their thermal signatures.
“Our present focus is in the financial, agriculture, and energy industries,” Fagan says. “In the financial markets, we have more than 12 distinct products ranging from oil and gas futures, GDP economic indicators, disaster impact analyses, reinsurance risk analyses, and agriculture commodities and futures analytics. In agriculture, the products include crop production rate monitoring, crop heath analyses, disaster damage, and economic assessment.” EOS has also developed analytics to support the agriculture supply chain where its data is utilized by seed producers, pesticide and fertilizer providers, processing plants and transportation logistics, he adds.
EOS is also working with nonprofit entities, especially regarding environmental issues. Examples include Blue Planet, a consortium of the United Nations that focuses on such things as oil spill detection, nitrates runoff pollution, and the status of coral reef deterioration; and the World Ocean Council, which brings together nonprofit research work and commercial enterprises to improve the environmental health of oceans, Fagan says.
CONCLUSIONS
When the U.S. Air Force was developing GPS, who knew that it would one day be used by consumers to find the nearest coffee shop, by shipping companies to track their trucks, or by seismologists to track the movements of the Earth’s crust after large earthquakes? Likewise, the explosion in the amount and varieties of EO data will generate innumerable and yet unforeseen new use cases and business opportunities.
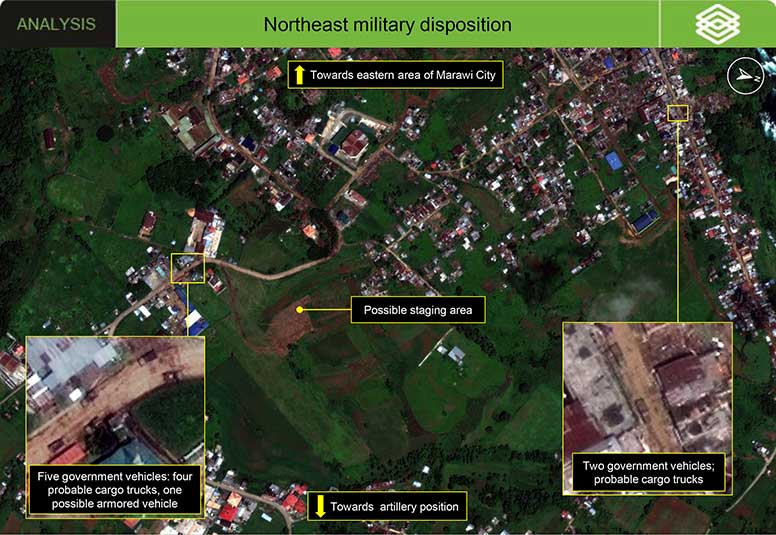
FIGURE 10. The Philippine Government Regains Control of Marawi City – According to AllSource analysis of GEOINT from 28 June 2017, eastern areas of Marawi City sustained widespread damage, and the Philippine government most likely occupies key civil, political, and military areas in the city’s west and northeast areas. Courtesy AllSource Analysis. Satellite image courtesy DigitalGlobe.