BY MATTEO LUCCIO / CONTRIBUTOR / PALE BLUE DOT LLC
PORTLAND, ORE./ WWW.PALEBLUEDOTLLC.COM
This series began a year ago by examining alternatives to Google Earth Enterprise, which Google will stop supporting on March 22, 2017; it then expanded to review a wide range of tools for geospatial visualization and analysis. For this installment, I discussed their companies’ offerings with:
Pat Ernst, Co-Founder and COO, PIXIA;
Riordon Kossen, Field Marketing Manager, Luciad NV; and
Kurt DeVenecia, Deputy Director GXP Product Development, GXP Technology
Area, BAE Systems.
PIXIA: FILTERING DATA ON THE FLY
PIXIA has traditionally focused on data storage, access, and management, particularly with regard to very large geospatial data—including aerial and satellite imagery, full motion video, Wide Area Motion Imagery (WAMI), lidar, and SAR. While some may not find storing and retrieving data particularly exciting, Ernst says, “We feel that it is a very important foundation to enable the entire value chain, including analytics and knowledge generation.”
While some of its customers prefer to run their software on their own infrastructure, PIXIA can provide a data hosting and management service or run it in something like Amazon Web Services (AWS). Its Kiosk product, part of its HiPER LOOK family of products, can also generate deployable drives that serve disconnected users. “It allows users to take a lot of data that is under management and tailor it to these disconnected drive servers,” says Ernst. They can be on commodity external hard drives, all the way down to microSD cards, and access the data through a local Web services call that does not require Internet connectivity.
Whenever possible, PIXIA’s products leverage OGC services—such as WMS, WMTS, and WCS—to download data. “Whether you are using a thin client—we have one called HiPER EARTH—or Cesium or some derivative thereof, or ArcGIS Earth, Google Earth, OpenLayers, or Luciad, you can access the data directly through these OGC services,” says Ernst. “That includes other types of thick clients, such as Arc and SOCET.”
PIXIA enables users to filter processed point-cloud lidar data on the fly and generate hill-shaded relief and other views, because on the back end it does not store that data as a tile cache. “So, if they want to see, say, a bare earth representation of that or a hill-shaded relief, they can do a lot of that, remotely, on the fly,” says Ernst. A more advanced user, he explains, can use GetFeatureInfo to download the LAS file and then visualize it in a more robust analytic tool, such as Quick Terrain Modeler or Quick Terrain Reader, which allows users to also spin, measure, and analyze a 3D point cloud.
“Lidar is very, very powerful, but it is really only geared toward the power user today for the most part,” says Ernst. “We are making those digital elevation models available to a much broader user base that can extract information from it, start to do some more advanced filtering, look at different derivative products on the fly, and then also enable the power users to download the point-cloud lidar data.”
Users can use a third-party globe in conjunction with PIXIA tools to visualize their data because the PIXIA client can merge raster and/or vector coverage coming in through a Web feature service with raster data that it is bringing in through a WMS server. PIXIA’s HiPER Look service can feed Google Earth in a very seamless manner, says Ernst, as well as offer other visualization and analytic capabilities, without requiring the user to make a separate copy of the data as some do now. “In our solution set, we are advocating that you make just one copy of the data and that can feed all of the different clients out there, whether thin or thick.”
“At our core, we are, and always have been, extremely focused on performance and scalability,” says Ernst. “So, particularly as the collection capabilities continue to advance and you are getting more high-resolution and larger volumes of data—that is really where we begin to shine, where the performance is not going to degrade.” Some of PIXIA’s customers manage literally tens of petabytes of data, he says, and the company wants to ensure that they are not waiting, looking at hourglasses. “Then, we focus on that dynamic aspect, so that you are not creating tile caches that are harder and more cumbersome to update, but giving the users the ability to do some of this filtering and visualization on the fly, while also keeping up a living and breathing representation of the data, as opposed to a pre-cooked version that grows stale after some period of time.”
Traditionally, PIXIA’s core market has been defense and intelligence. However, as commercial applications of geospatial data have continued to mature and are now using very large data volumes—particularly in such classic big data markets as oil & gas, medical imaging, and digital media entertainment—PIXIA is branching out into some of those spaces, Ernst says. It is partnering with other companies to develop collection and analytics capabilities. “As we are seeing more aerial and overhead imagery, lidar, and some of these other large datasets explode, we are also seeing some of the barriers to entry for some of these other markets start to decrease in size, so that we can start to offer managed services and to reach out to many of these organizations in a more coordinated fashion, rather than having to attack each market segment one at a time.”
PIXIA has done some work in the defense and intelligence world in support of WAMI, which provides
consistent surveillance of very large areas, and is now following closely its translation to commercial applications, such as to monitor production plants or oil & gas facilities. “We are very interested in looking at this idea of WAMI as a service, and partnering with some folks on the collections side of the analytics as well,” says Ernst.
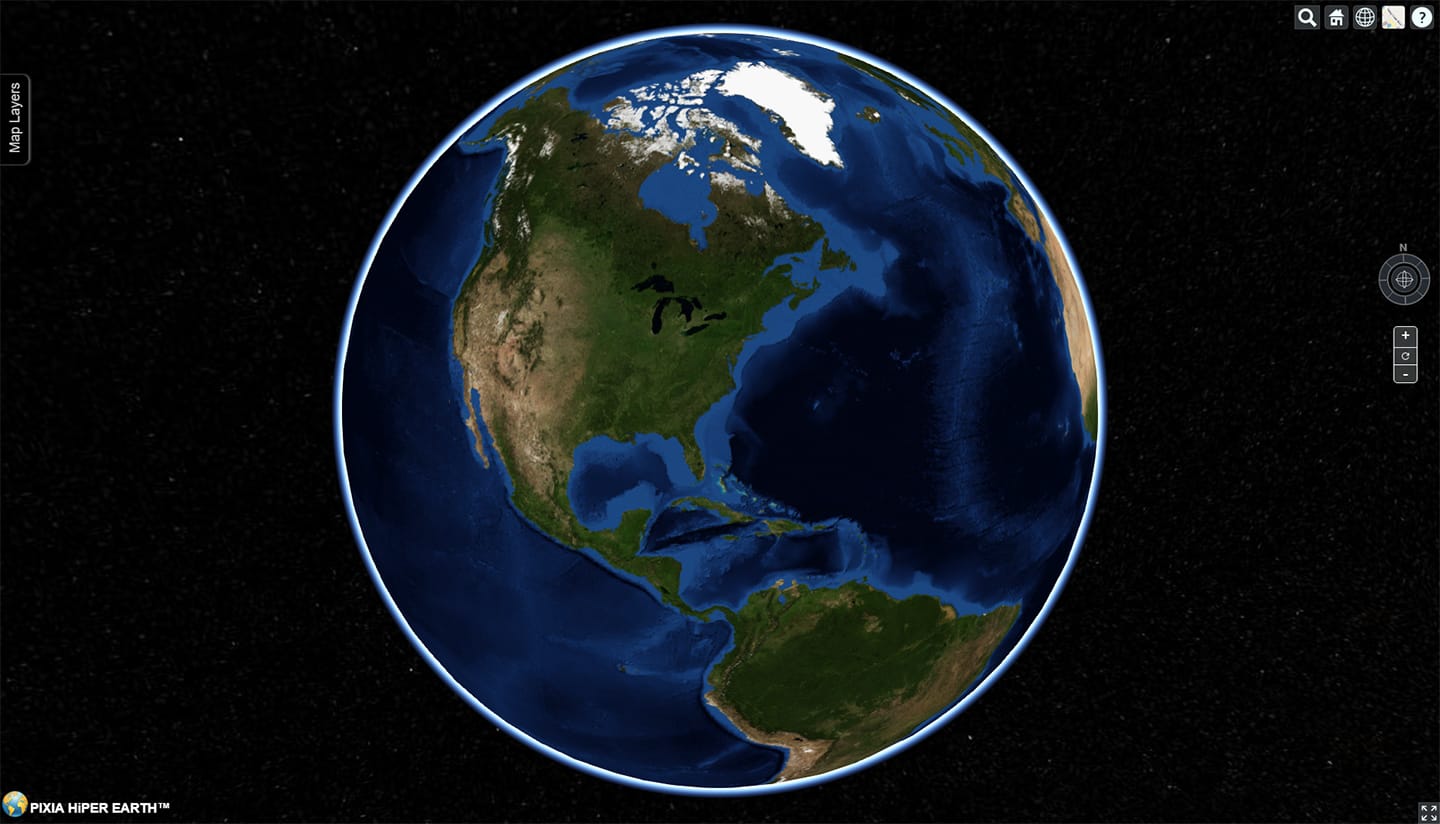
PIXIA’s HiPER LOOK product line deals primarily with the types of data that Google Earth has dealt with. It can ingest and manage very large volumes of data and serve it out. The product line includes a thin client called HiPER EARTH. See Figures 1-2.
“We have a very large variety of users out there and we feel pretty passionately that they ought to be able to bring their own clients,” says Ernst. “Many times they have a strong predisposition toward a particular analytic client—such as a Cesium-based client, ArcEarth, Google Earth, OpenLayers, Luciad, FalconView, or SOCET. We have the ability to service all of those different clients and, again, to do so through OGC services.” Additionally, like Google Earth Enterprise, PIXIA can create portable globes on what it calls deployable drives. They can range anywhere from hundreds of terabytes all the way down to several hundred megabytes onto a microSD card.
“PIXIA is dedicated to developing the world’s fastest and most scalable geospatial data management
solutions,” says Ernst.
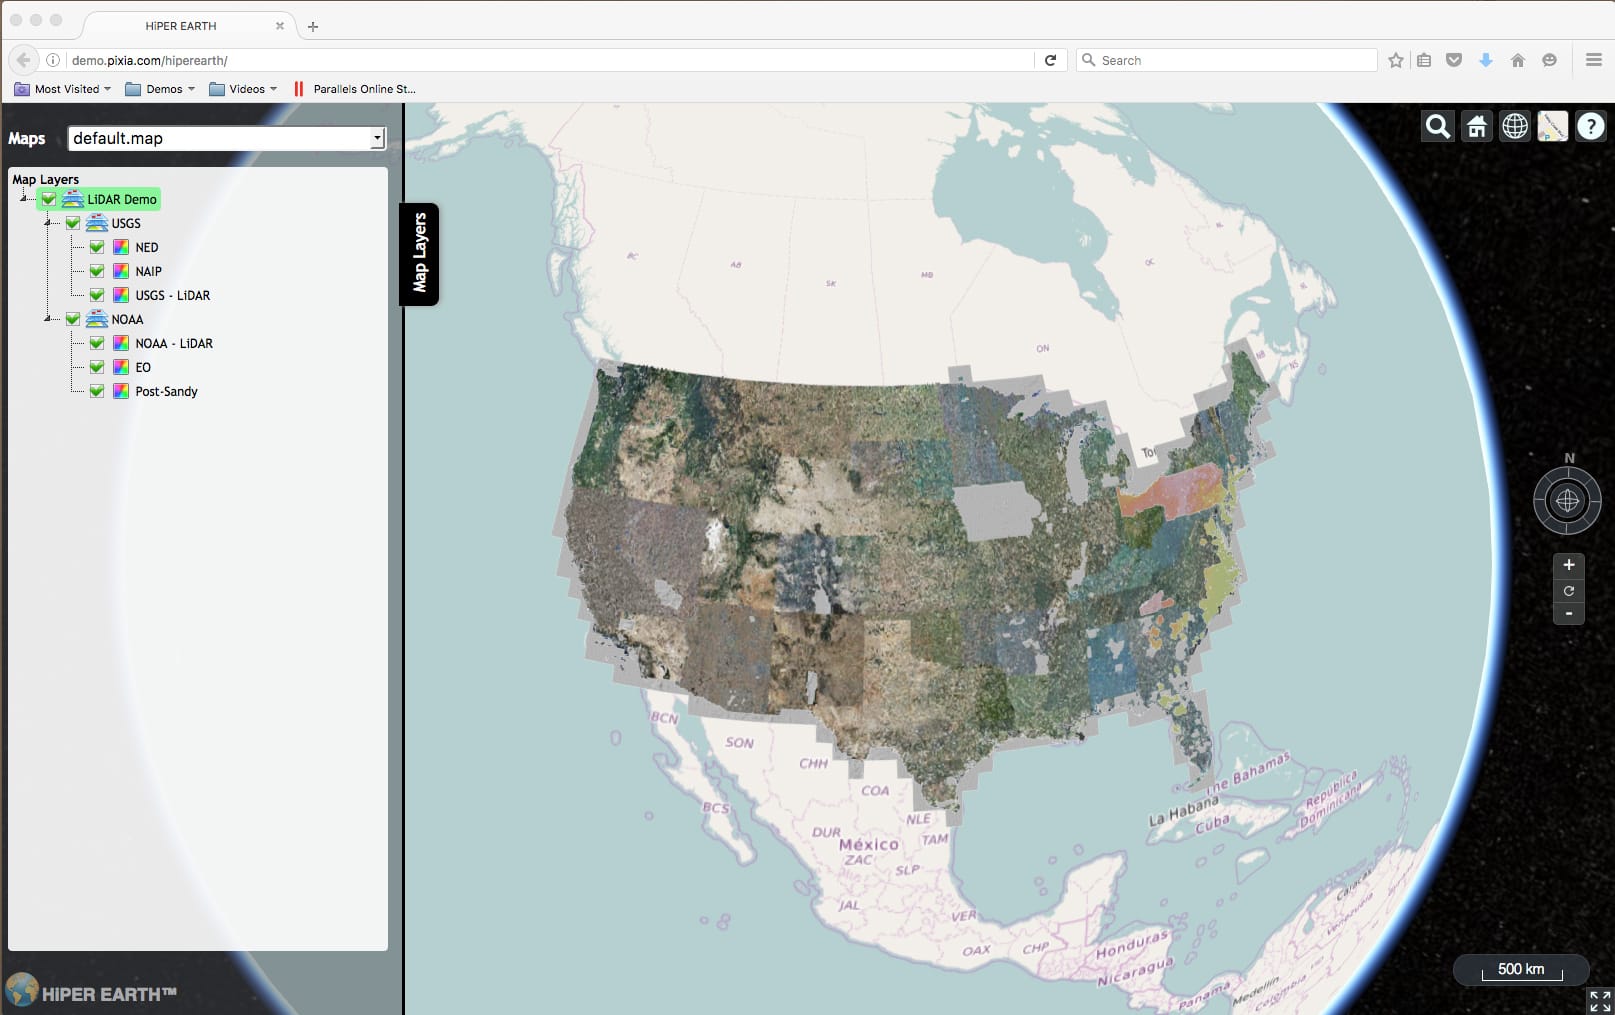
FIGURES 1-2. PIXIA’s HiPER EARTH user interface provides direct visual access to the contents of the HiPER LOOK server and runs directly in an Internet browse
FIGURES 1-2. PIXIA’s HiPER EARTH user interface provides direct visual access to the contents of the HiPER LOOK server and runs directly in an Internet browse
LUCIAD: API TO BUILD ANY GEOSPATIAL
APPLICATION
Luciad is based in Leuven, Belgium, close to Brussels, has offices around the world, and has a network of local Luciad Certified Partners. The company was founded in 1999 as a spinoff from the University of Leuven and still has a very strong link with it. The founder, Kossen recalls, was working at NATO and saw a need for geospatial visualization and merging different sources of geospatial information in a common operational picture. Such a solution was not available, so he began to develop an API that would allow developers to build any geospatial application. “That is still exactly the strength of the product today,” says Kossen. “That objective has not changed over the years. Today, we still provide geospatial components to develop geospatial applications of any type that need to visualize different sets of information and draw conclusions from that, helping the user make decisions.”
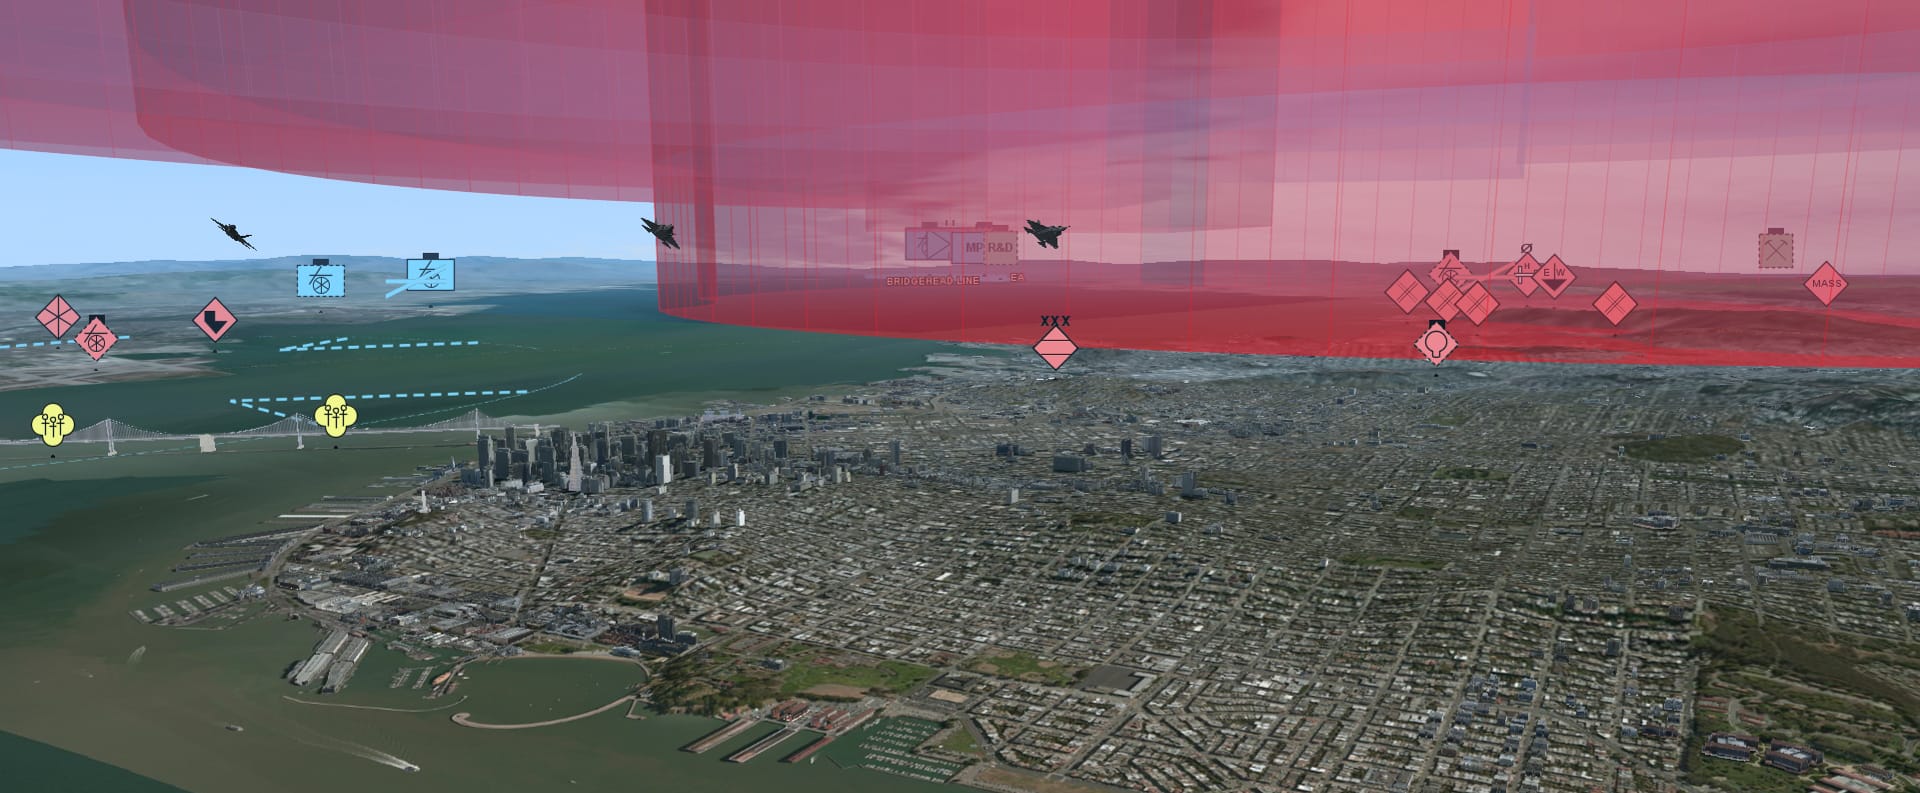
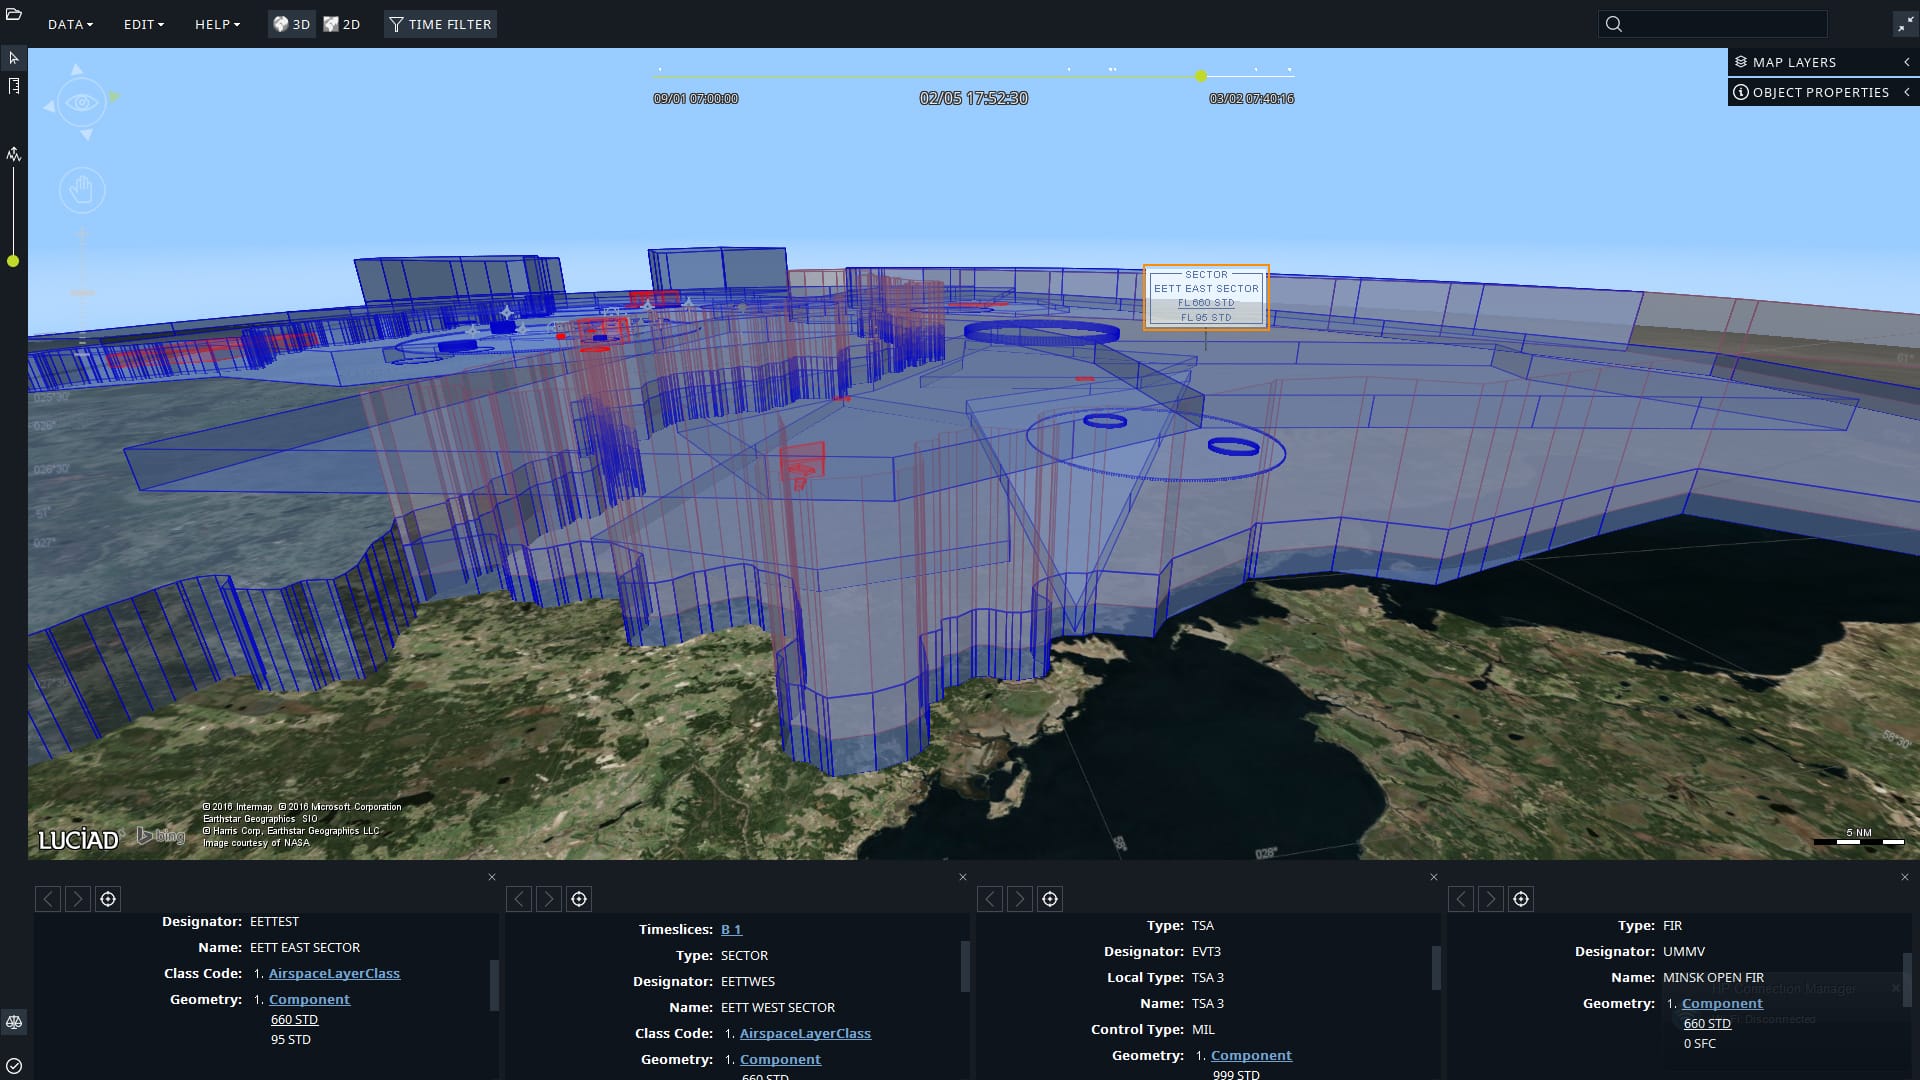
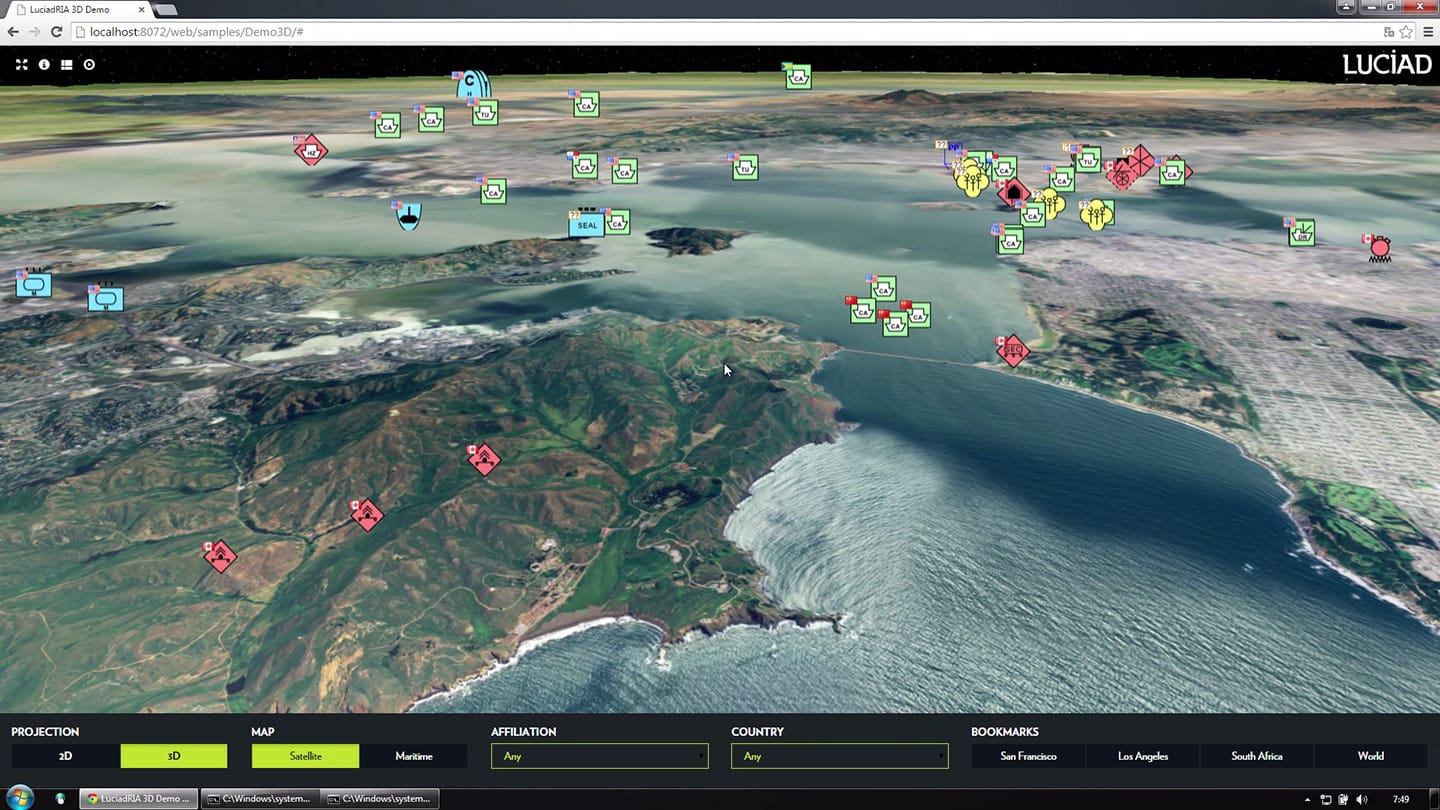
Luciad comes from a defense background. “That,” says Kossen, “has helped us to become so successful, because the requirements for defense-related projects are typically very high and they are a challenge to meet.” Meeting those challenges opened the doors to other domains, such as aviation, maritime, and logistics. “Moving dots on a map can be jet fighters, moving very fast, or cars on the road, moving not so fast, or a person in an amusement park that is being tracked,” says Kossen. “So, our software is very well suited to handle both static and dynamic data, visualize it, and then do visual analytics that help the user make a decision.” See Figures 3-4.
Luciad does not sell an end-user product, but software components. It typically sells them to system integrators that develop end user systems incorporating its products. The company also has a department that supports system integrators in developing those applications and sometimes develops full applications for specific end users. Its customers range from national defense ministries to NATO to aviation authorities, such as the U.S. FAA or Eurocontrol in Europe or local entities that deal with flight information in a country, to system integrators, such as Thales, SAAB, SAIC, and Boeing.
Luciad’s customers with mobile applications use LuciadMobile, those with browser-based applications use LuciadRIA, and those with server-based products run LuciadLightspeed, the company’s flagship product, on desktops and servers. They may also run LuciadFusion, which is a server-side solution for manag- ing data for distribution in large amounts or to different types of applications. “Within these products, we have a range of capabilities specific to the domains in which we are active,” says Kossen. “Straight out of the box, our products support the commonly used data formats and symbologies used in the defense, aviation, and maritime sectors.” See Figure 5.
Connecting to the data is the first step toward visualizing it and analyzing it. “For example,” says Kossen, “you can connect to a satellite image of a certain region, then combine it with elevation information, visualize street data, and visualize, for example, the airports, then show dynamic data, such as live air traffic feeds or recorded feeds. Our product contains everything needed to do that.”
“Our product is developed for big data,” says Kossen, both static and dynamic, as well as Twitter feeds and so on. “All of this information is very valuable if you can visualize it in a good way. We have specifically designed our products for that.”
Luciad provides 2D and 3D Earth models. Together with the software components, it delivers samples and even complete starter applications. For example, Lucy is a Luciad Lightspeed application component that provides a 3D globe onto which users can drag and drop their own information. “You can export it again, you can print it, you can do everything that you can do with other basic GIS tools,” says Kossen, “but you can also do advanced analysis and analytics on top of that.”
LuciadFusion, a server-based application, can replace Google Enterprise Fusion, Google Enterprise Server, or Google Enterprise Portable, says Kosson. “LuciadFusion does more and better than what Google Earth is doing,” he says. “So, we are positioning LuciadFusion as a replacement for it.”
Luciad is also a driver of open standards, says Kossen. “We don’t like closed formats so we are focusing very specifically on open standards; we support them. We are a member of the Open Geospatial Consortium.”
The company also does a lot of research on big data issues, says Kossen. “Another important aspect is that we have a very unique and good tiling mechanism, which is used, for example, in LuciadFusion. It allows you to load any traditional raster and vector data and tile it and make it available to any other application, either in this tiling format or even in an open standard. It is very well optimized for combining that with other datasets, such as real-time feeds.”
BAE SYSTEMS: DIGITAL PHOTOGRAMMETRY
FROM STONEHENGE TO MARS
DeVenecia works for BAE Systems’ Electronics Systems sector’s Geospatial eXploitation Products (GXP) business group, which has about 250 employees and produces mostly software products. “Our software started out with desktop applications,” he recalls. “We basically replaced the old analytical plotters with SOCET SET. That was the beginning of digital photogrammetry.” Over the years, BAE Systems advanced SOCET SET into SOCET GXP, which is now its premier desktop solution for exploiting imagery and other geospatial information. “It does a lot more than SOCET SET did,” says DeVenecia. “It runs the gamut from photogrammetry to very simple image analysis. So, our user base is much broader than it was with our previous software solution.”
BAE Systems then moved into server software and developed the GXP Platform, which is the foundation for derived products that it has running in browser applications. “The GXP Xplorer search and discovery tool finds geospatial and non-geospatial data for you,” DeVenecia explains. “It allows you to query all that information and serve it to other products, like GXP WebView, which is our imagery exploitation tool in the browser, and SOCET GXP, as a client in the desktop. We also have mobile solutions, GXP Xplorer Mobile and GXP Snap, which are also enabled by the GXP Platform. Our new product is GXP OnScene, which provides support for the first responder market.” See Figures 6 and 8.
While BAE Systems offers a database for storing and extracting features and vectors out of imagery, “for true GIS,” says DeVenecia, “we partner with Esri. People use our applications to feed information into ArcGIS and we also use the content out of GIS in our applications.”
GXP Xplorer’s background is a map that can come in OGC format from Google Maps or from WMS or WMTS servers. “When people do queries and want to understand where data is for their particular area of interest,” DeVenecia explains, “they see the footprints and the details and the points on a map. If there is terrain out there, the terrain footprint will show up. If there is imagery, that will show up. The same goes for video and feature data. Even documents, if they contain coordinates, will be displayed as points on the map.” It crawls the enterprise for geospatial data: if data shows up at a location, the program catalogs it and then disseminates it to those who need it. See Figure 7.
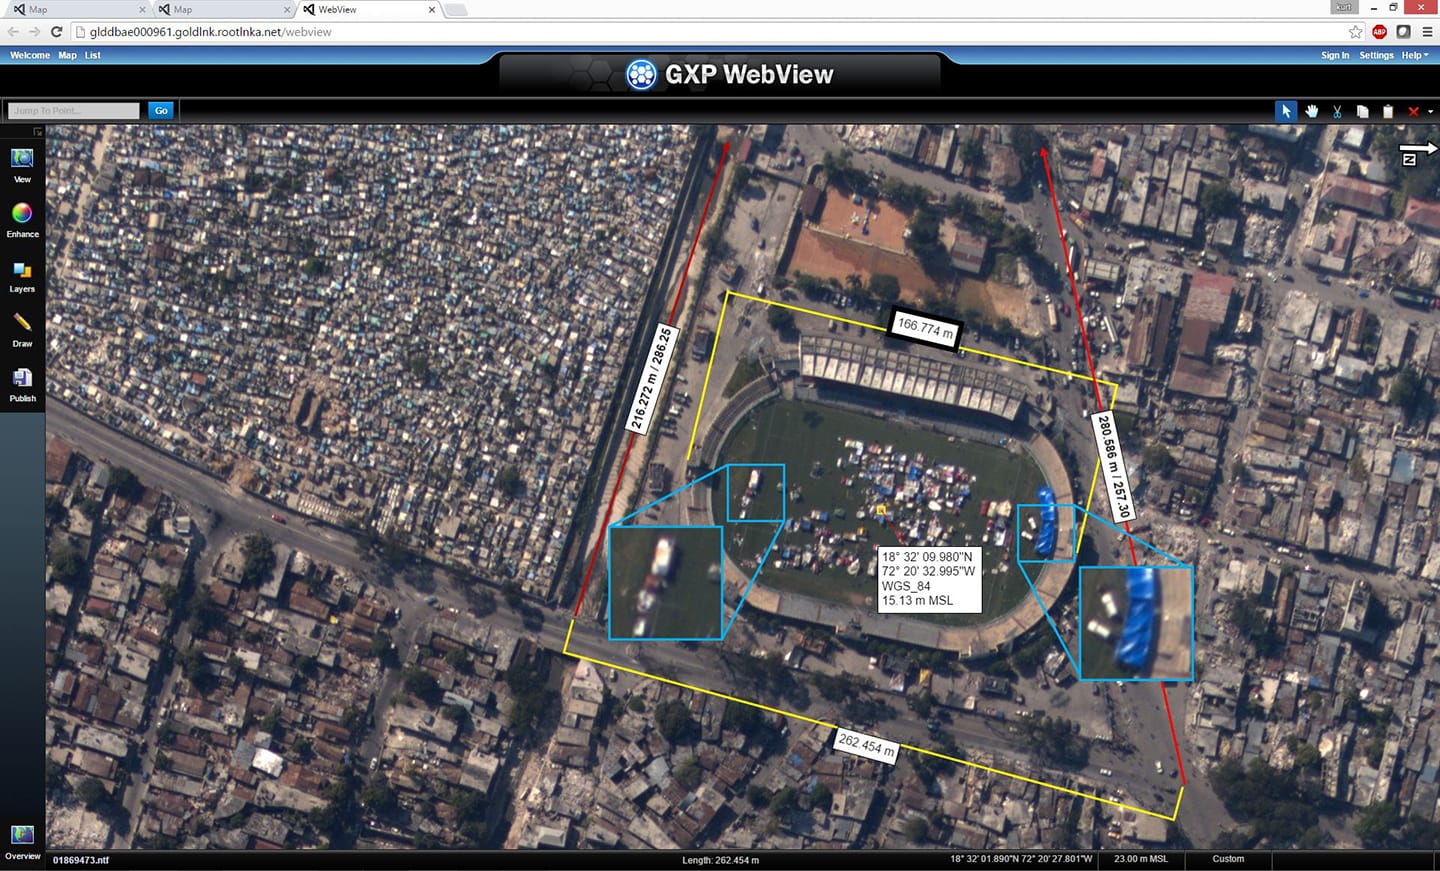
FIGURE 6. Demo image from BAE Systems’ GXP WebView depicting coordinates, measurements, and additional annotation capabilities. Imagery courtesy of DigitalGlobe.
FIGURE 6. Demo image from BAE Systems’ GXP WebView depicting coordinates, measurements, and additional annotation capabilities. Imagery courtesy of DigitalGlobe.
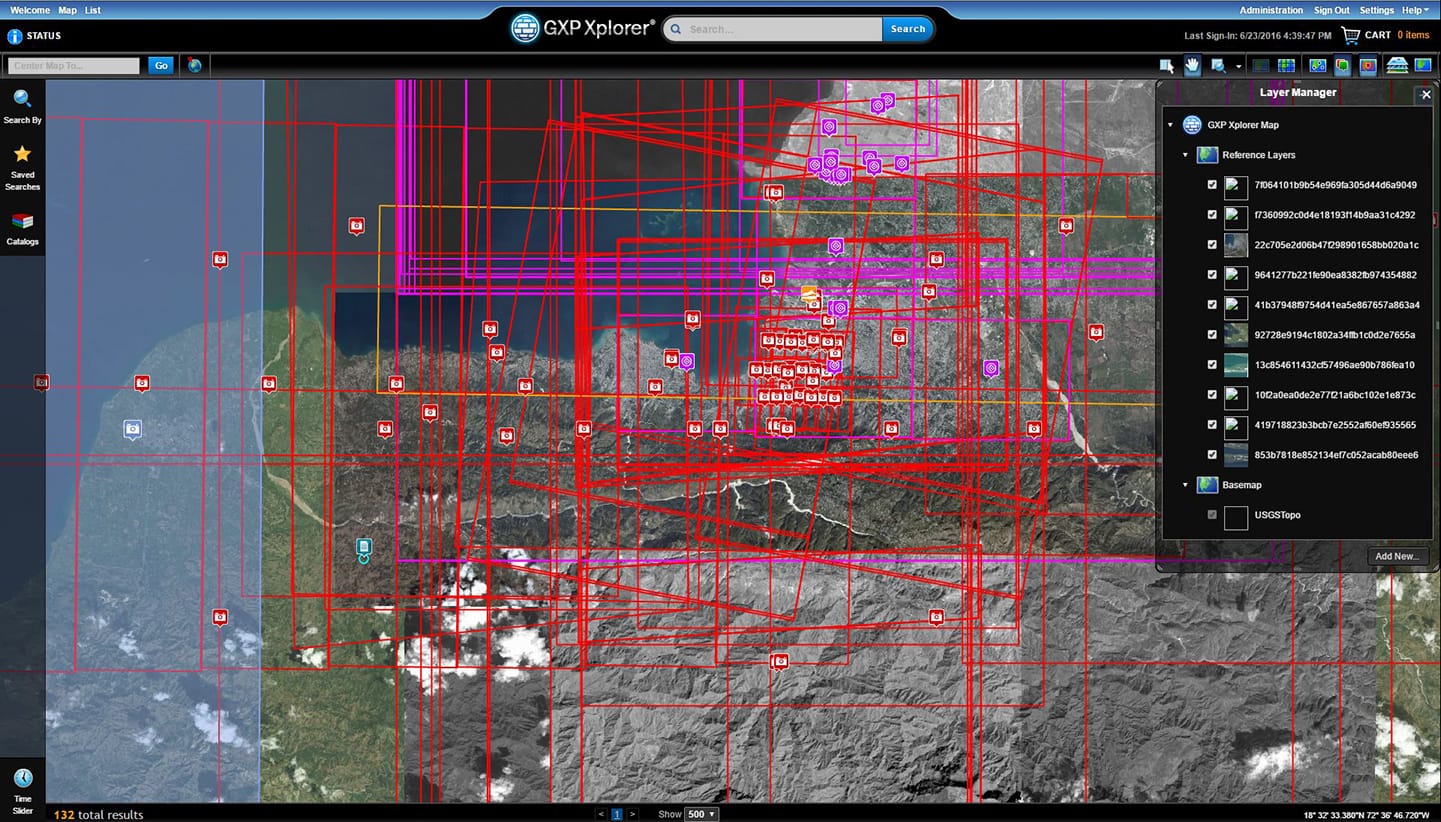
FIGURE 7. Demo image from BAE Systems’ GXP Xplorer depicting available data footprints and Layer Manager capability. Imagery courtesy of DigitalGlobe.
FIGURE 7. Demo image from BAE Systems’ GXP Xplorer depicting available data footprints and Layer Manager capability. Imagery courtesy of DigitalGlobe.
BAE Systems’ major market is defense, but it also works with civilian government agencies, such as USGS. It is currently working on some of USGS’ planetary missions. “The USGS built terrain models for asteroids, the moon, and Mars and things like that with our software,” says DeVenecia. “USGS has integrated some of their sensor models into our software and can use them for those types of applications. USGS also works on volcanoes, so we are doing terrain analysis of volcanoes, as well as such things as developing tools to monitor volumetric changes of glaciers.”
As part of the development of its GXP Platform software, BAE Systems has built upon its legacy developing server software containing a rich set of algorithms for exploiting imagery and performing photogrammetric math. It hosts that server solution on AWS and provides applications that allow first responders to communicate, collaborate, and share information using a Common Response Graphic (CRG), which DeVenecia likens to a Thomas Brothers grid on top of an image. “That way,” he says, “they can easily communicate with one another on current, relevant imagery and track each other. Our commander application allows command and control elements to help orchestrate where people are and where they need to go. That is one of our emerging markets.”
BAE Systems, according to DeVenecia, has had conversations with DigitalGlobe on putting its algorithms on the latter’s GBDX platform. “We use their content in our applications, but they don’t have our algorithms within GBDX yet. They are a content provider for our GXP Platform, along with a number of other satellite imagery providers and aerial photography firms.”
BAE Systems is also involved in close-range photogrammetry. The USGS used BAE Systems software on its Mars missions to derive some of the close-range models of the rocks and craters it was investigating in front of the rover. BAE Systems software was also used to model Stonehenge from close-range images. “The application works quite well in close range as well as in normal photogrammetry applications, such as with satellites and aerial photography,” says DeVenecia.
BAE Systems’ applications “are very tuned to doing things in a rigorous sense,” says DeVenecia. “We have been doing digital photogrammetry for decades. We were probably the first ones to actually do digital photogrammetry for the U.S. government. So, our algorithms are sound and they are the foundation for the work that we do.”
Probably BAE Systems’ key discriminator, DeVenecia says, is being able to derive information from oblique images that have not been altered and orthorectified, while also being able to serve out imagery as
OGC-specific content for end users.
“Our customers use Google Earth Enterprise, Google Earth, and Google Maps with our software for things like collaboration and situational awareness,” says DeVenecia. “They are able to take our derived products or the products that they derive from our solutions and put them on top of the Google Earth globe in KML format. However, that is something that our users are moving away from because it is going away.” GXP Xplorer can be used to collaborate and share information at an enterprise level.
“The amount of geospatial information in our hands is just tremendous,” says DeVenecia, pointing to both traditional sources and new ones such as UAS and mini-satellites. Therefore, he argues, automation is a key to analyzing all of this vast quantity of geospatial content and deriving answers from it. One bottleneck, he points out, are some of the communications networks, which can make it challenging to use the servers to their maximum efficiency and get the answers across the networks and out to the end users.
Users require and expect more sophisticated tools to visualize and analyze remotely sensed geospatial data— whether they be static features, slow-moving pedestrians, or fast-moving vehicles, and whether the imagery be nadir or oblique, orthorectified or not. As advances in collection capabilities continuously increase the already tremendous volume and resolution of this data, the companies profiled in this series continue to develop new ways to merge and visualize them in a common operational picture.
