Wind’s contribution to energy production in the United States continues to grow. In 2011, it represented a third of all new electric generating capacity. Individual wind turbines are getting larger in power-generating capacity, hub height, and rotor diameter—largely in order to make wind turbines viable in areas with lower wind speeds. This growth is expected to continue.
Decisions about where to site commercial-scale wind turbines—typically costing $3-4 million each installed (though their cost drops significantly with economies of scale for large wind farms)—require detailed, reliable, and long-term data about wind speed and direction. Wind speed maps and tables published by the National Renewable Energy Laboratory (NREL), the U.S. Department of Energy’s primary laboratory for renewable energy and energy efficiency research and development, are a good starting point.
However, resource assessment (to identify locations with sufficient wind speeds for turbines to work efficiently) and forecasting (to know whether the long- term average wind speeds make investments in wind energy cost-effective) require much more detailed knowledge of local wind conditions. Additionally, real-time measurements of the speed of approaching wind gusts, fed into the turbines’ control systems, can enable them to instantly adjust the gears so as to maximize energy production while minimizing the chance of mechanical failure. Currently, the two preferred technologies for collecting wind data are ground-based SoDAR and LiDAR.
REQUIRED DATA
Siting decisions for wind turbines typically require a few key types of data. “Initially, we do some meso-scale modeling for a particular region,” says Dr. Jeffrey Freedman, the Lead Research Scientist at AWS Truepower, LLC, a renewable energy consulting company with a staff of approximately 75 meteorologists, engineers, and environmental specialists. “We will couple that with terrain-based models that will tell us at 50-meter to 100-meter resolution roughly what the wind speed is at 80 meters or 100 meters above the ground and that gives you a rough idea of what the wind speed field looks like.”
Next, on-site measurements of wind speeds are necessary in order to estimate how they will vary over the project’s lifetime. “That tells you essentially how much money your project is going to make based on the type of turbine that you are going to put out there,” says Freedman. This requires at least a year’s worth of continuous measurement from towers. However, because most towers are lower than the turbines’ rotor planes, SoDAR or LiDAR sensors are used to study local wind shear (the change of wind speed and direction with height).
Finally, he explains, you need a description of the wind climate, which requires longer-term data. “You hope that somewhere nearby there is a long-term climate station that has a record that is 10, 15, or 20 years in length. Then you do a statistical regression between your short-term measurements on site and the longer-term climate station measurements and use that relationship to project what you think the long-term wind climate is on site.”
Daniel Ngoroi, Remote Sensing Team Lead for Woolpert, a large design, geospatial, and infrastructure management company, would combine this wind data with elevation datasets derived from the airborne LiDAR data that his company produces. He would also gather land use and land cover maps. “I want to know where my open fields are, where my forests are, where water is. I also want the zoning information, if the area is zoned, and wind turbine guidelines published by various government agencies, which are supposed to guide you in determining areas that are restricted, based on certain wildlife or vegetation. One of the issues with wind turbines over the years has been the obstruction of migratory paths for certain birds.”
Additionally, says Ngoroi, “it would be nice to have things like transportation and transmission line data that allow me to build buffers around those transportation corridors and transmission line corridors, because wind turbines need to be located within certain distances of transmission lines, in order to be able to get the energy to wherever it needs to go. So, if you take all those pieces of data together, then you can produce maps that show suitability zones: here is the area that has this amount of wind speed, usually a sustained wind speed of 10 miles per hour and above, and then it intersects this land use category and it is close to this transmission line corridor and to this transportation corridor.” See Figures 1-2.
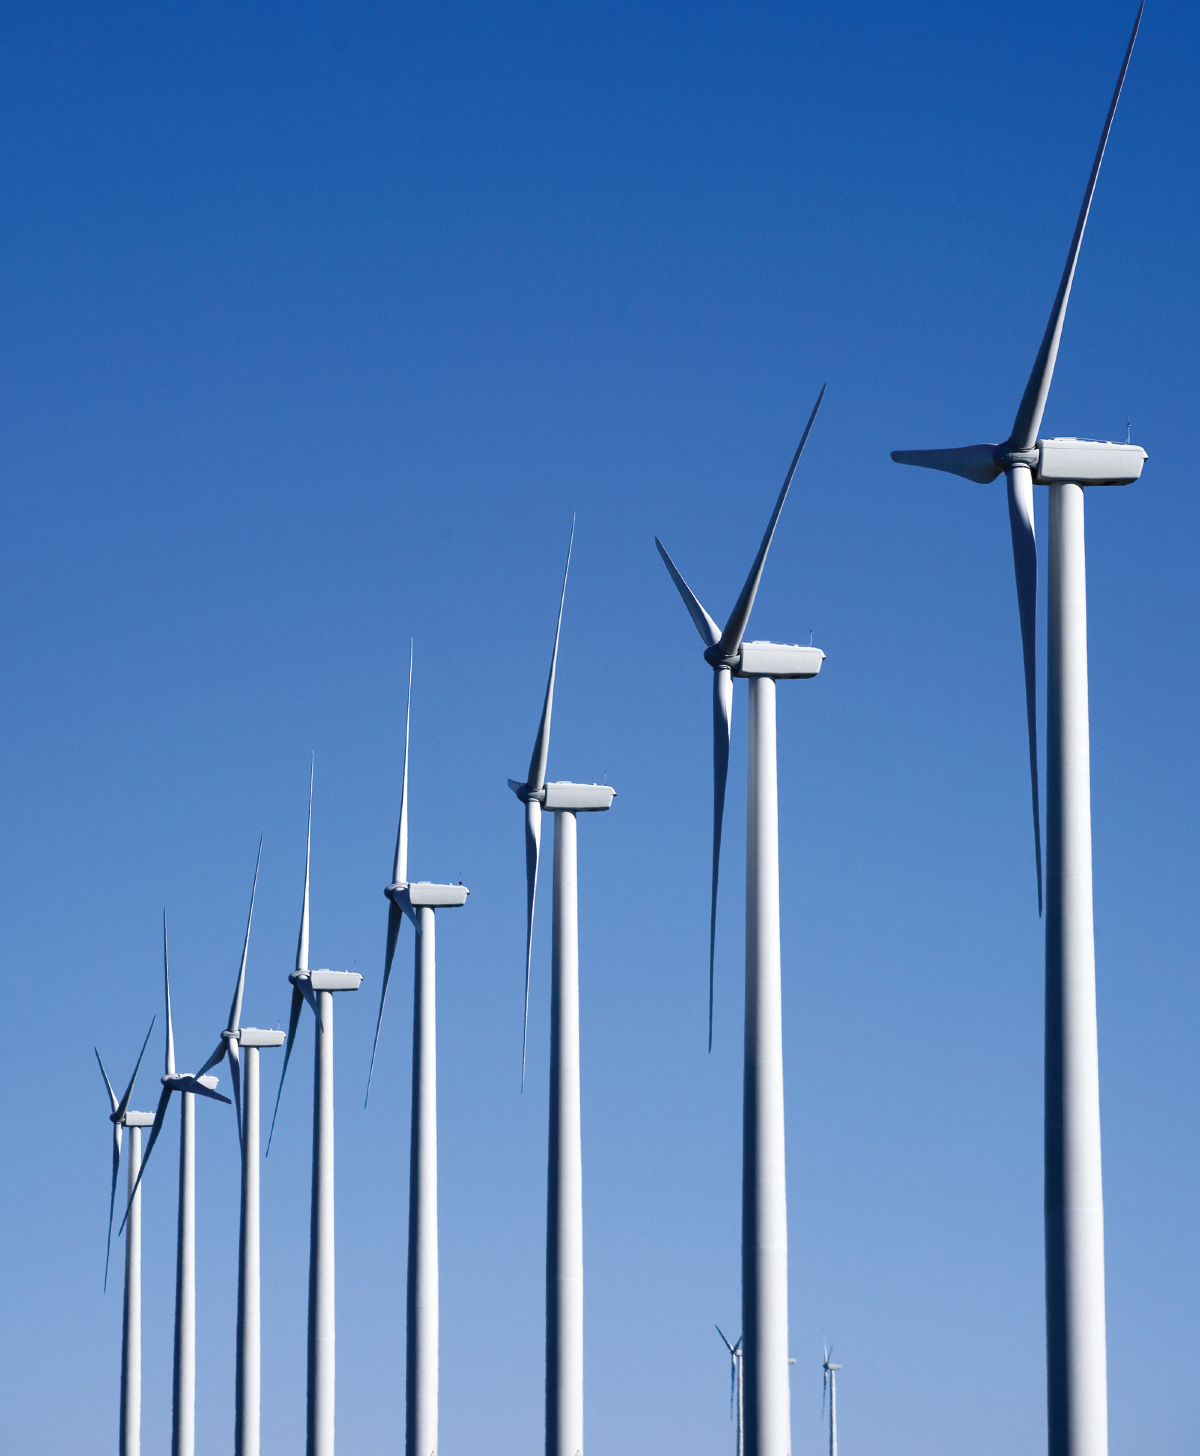
FIGURE 1.
Big Horn Wind Farm. Photograph by Iberdrola Renewables, Inc. Courtesy of NREL.
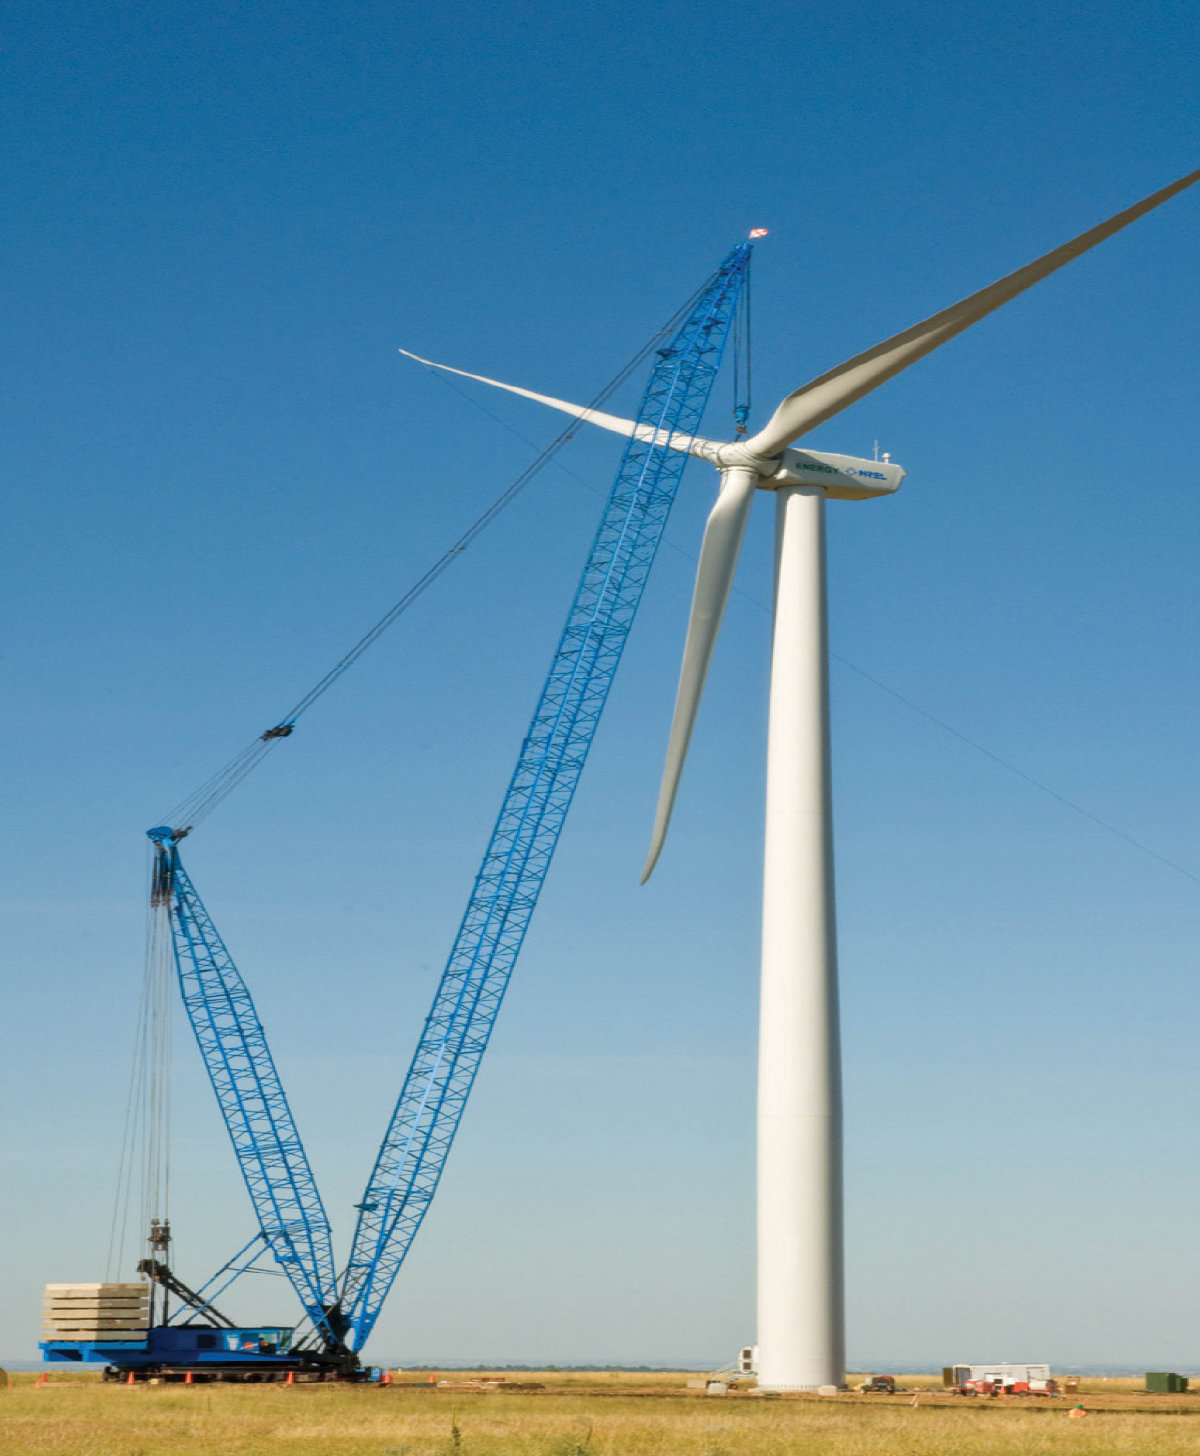
FIGURE 2.
Blue skies and calm conditions contributed to a smooth installation of a General Electric 1.5 MW wind turbine at the National Wind Technology Center. Photograph by Pat Corkery. Courtesy of NREL.
LiDAR
Airborne and ground-based LiDAR sensors are usually used for measuring and imaging hard surfaces, such as terrains or buildings. For the purpose of measuring wind speed, however, they are pointed upward from the ground and the backscatter energy reflects off of aerosol particles in the air that are moving due to wind turbulence. Wind speed and direction is then derived by measuring the Doppler shift and mapping it into a model.
“Even though the air might seem clean, there are plenty of dust and dirt particles floating out there at the sizes that you need and given the wave- 2 lengths at which you are transmitting,” explains Freedman. “They are in sufficient concentration to generate a decent amount of statistics to give you the average wind speed and direction over periods of a few minutes. Typically, LiDAR will give you decent measurements, depending upon their transmission power, in the thousands of meters vertically or horizontally.” See Figure 3.
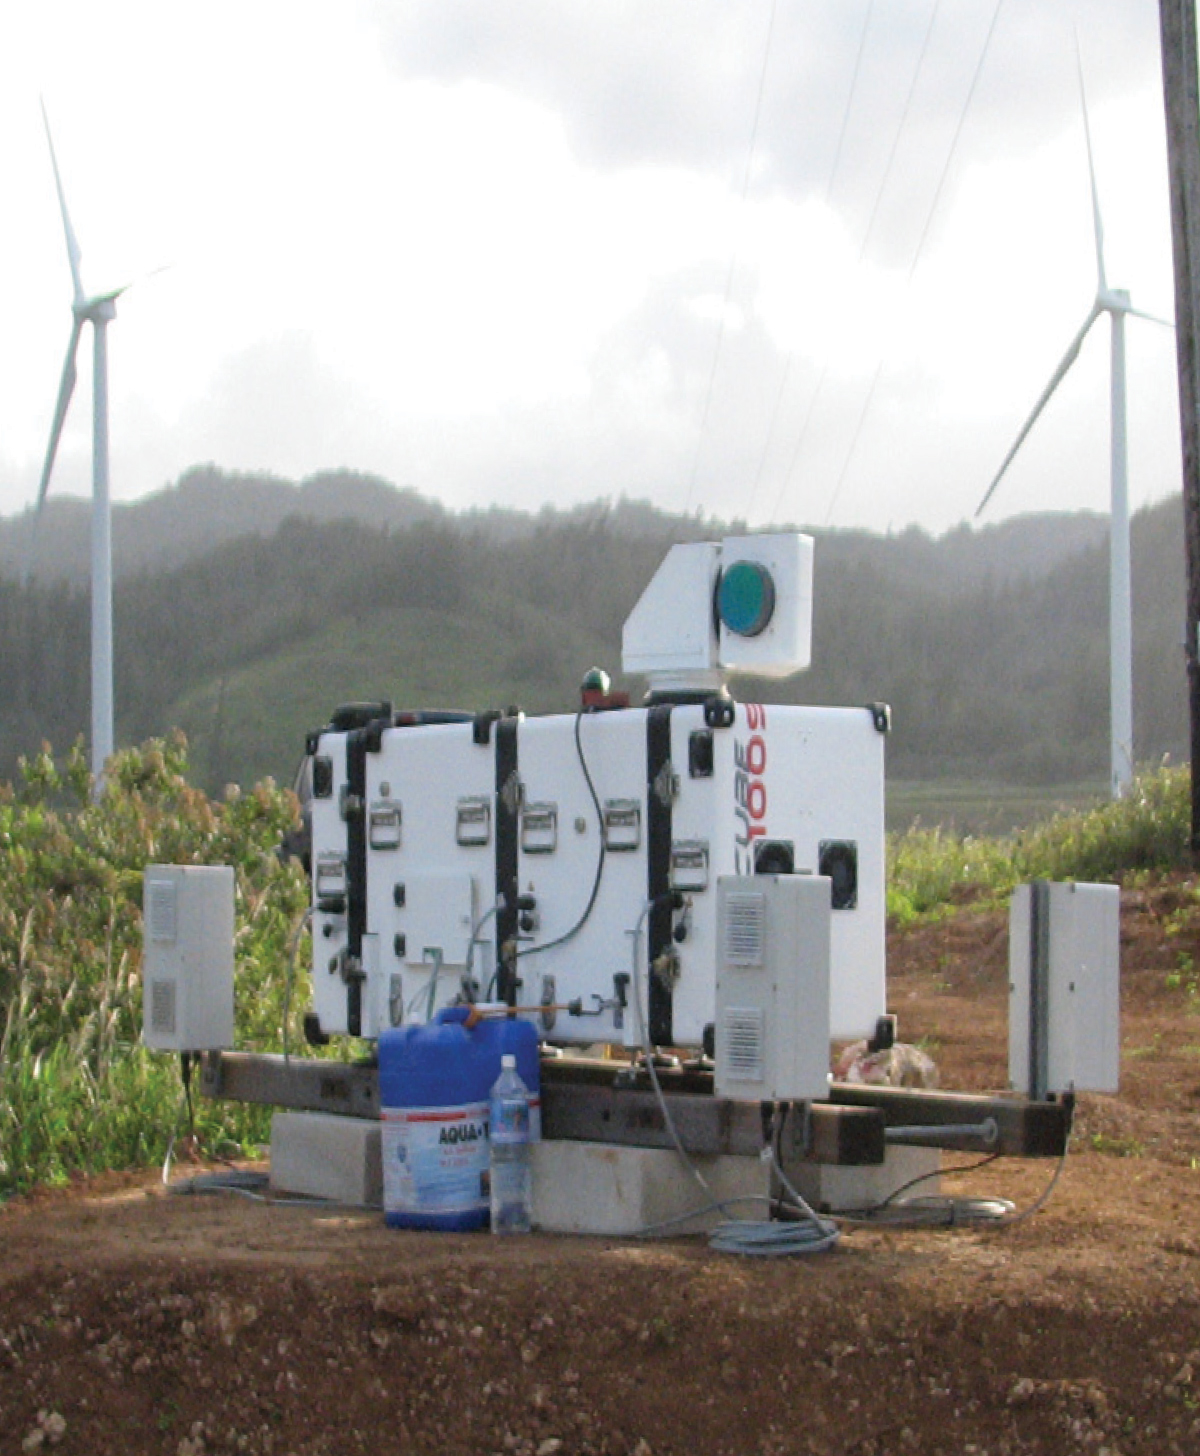
FIGURE 3.
Leosphere scanning LiDAR owned and operated by the Hawaiian Electric Company (HECO) at the Kahuku Wind Farm. Photo by Matthew Filippelli. Courtesy of AWS Truepower.
SoDAR
SoDAR sensors send out sound pulses that reflect off of turbulent eddies containing local gradients of temperature and wind speed, explains Andrew Clifton, a Senior Engineer at NREL. Typically, he says, “you send out one or more beams to describe an arc above the device. That way, because you are looking at the wind field from several different directions, you can back out the vector of the wind that is moving through the points. Often, you look up, then you look north, and then you look east, with an off-vertical angle of 30 degrees for both directions. There are many variations on this technology.”
In most cases, assuming that there is no acoustical interference, SoDAR will be a very good data source in terms of describing the vertical profile of the wind direction, says Freedman. Even though SoDAR sensors cost between $50,000-100,000, they are cheaper in the long run than building towers. See Figure 4.

FIGURE 4.
Atmospheric Research and Technology SoDAR owned and operated by the Hawaiian Electric Company. Photo by Amra Brightbill. Courtesy of AWS Truepower.
COMPETING TECHNOLOGIES
The data collected using LiDAR or SoDAR can be quite similar, says Clifton. “We normally get the wind speed and direction at multiple heights above ground, which tend to be anywhere from 10-300 meters. We’re also seeing new types of LiDAR on the market that allow us to measure out to about 15 miles and measure the wind speed in the line of sight in a small area.”
SoDAR and LiDAR are somewhat competing technologies. “Many people were familiar with SoDAR technology from meteorology; it has been used quite intensively by national meteorological services and by universities over the last 15-20 years, if not longer,” Clifton points out. “However, it tends to require attended operation and suffers a little bit with signal attenuation over height. LiDAR systems started to become commercially available about eight years ago and have since become cheaper and more widely available. So, we are now at the point where SoDAR and LiDAR have slightly different costs and benefits.”
“SoDar is the baby brother to LiDAR, owing to its limitations, but it has its place in wind energy studies.” say Ngoroi. “It is an older technology that is now being retired and rapidly replaced by Doppler LiDAR.”
RESOURCE ASSESSMENT
To determine the suitability of an area for wind turbines, “you have to start with something,” says Ngoroi. “Usually, the place to start would be the published wind speed maps. However, they cover such wide areas, that you want to narrow that down to something that covers the average area of a wind farm.” See Figures 5-6.
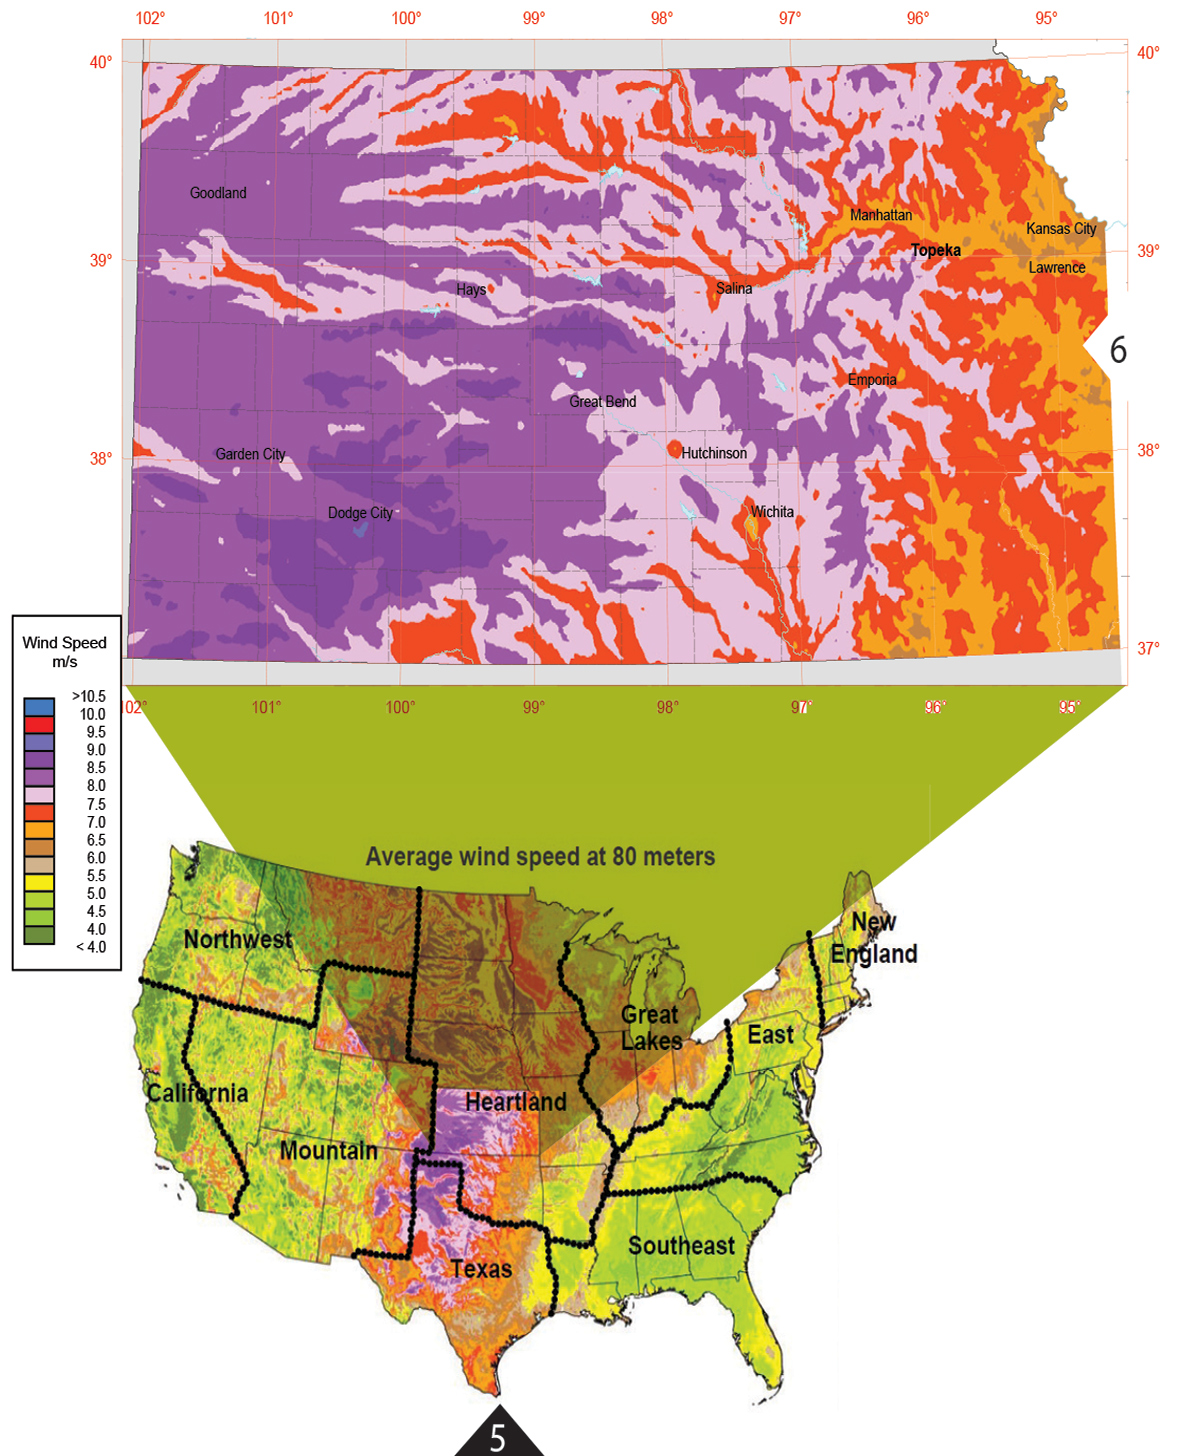
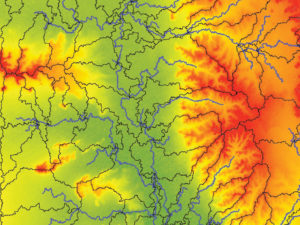
FIGURES 5-6.
Average wind speeds in the United States and Kansas at a height of 80 meters. Courtesy of AWS Truepower and NREL.
Traditionally, for resource assessment, the industry has used towers 40-80 meters high with instruments mounted on them that provide point measurements at various levels, says Freedman. “The problem is that these point measurements are not representative of where today’s larger wind turbines are operating, because the typical hub heights are now 80 meters, 100 meters, or even 120 meters. That means that their rotor plane can extend up to 150 meters in height. There are empirically based relationships that give you the change in wind speed with height (that is, the wind shear). The problem is that we don’t know for certain how representative that estimate is.” Additionally, the number of existing towers is tiny compared to the number of potential locations for wind turbines and it is very expensive to build new ones.
That is why wind energy engineers use remote sensing instruments to measure wind speeds. “They will give you measurements that extend through the rotor plane,” says Freedman. “Typical SoDARs that we use have measurement heights of up to 200 meters. Both SoDAR and LiDAR are typically used as vertically pointed instruments that give you a volumetric measurement, because they are giving you a sample volume at different levels, say, from 30-200 meters at 10-20-meter height increments. So, that’s giving you a more representative wind description. The industry is slowly moving in that direction. Frequently, you will find resource assessment campaigns that pair tower based measurements with shorter-term deployment of SoDARs and LiDARs.”
The future in the industry is in remote sensing, Freedman argues, “because you would rather have actual remote measurements at heights where you are going to be placing the turbines, than have to extrapolate what you think the wind speed may be based on tower measurements. Over time, you will have a combination of these two. Eventually, as turbine heights get higher and higher, the industry will perhaps even align with the exclusive use of remote sensing to describe the resource at those heights.”
FORECASTING
The data required for forecasting, to build a model and do the analysis, “come from specialized agencies that have been doing this kind of forecasting for years and have built models and databases that are populated by on-ground readings,” explains Ngoroi. In this case, NREL’s published wind forecasting model is used. “They have been studying wind speeds using weather stations all over the country. I can also take elevation and slope data and use that as one of the inputs into the NREL wind forecasting model.” Additionally, Ngoroi would take climactic data, which is published by various agencies, to do 5-10-year forecasts. “Forecasting becomes almost an exercise in combining the geospatial data with datasets that are produced by NOAA or NREL.”
In Hawaii, where there is a strong push to deploy and use renewable energy because energy costs there are very high, there are many wind farms, large solar power installations, and rooftop PV panels. AWS Truepower has developed a sytem for Hawaiian electric utilities that helps their operators predict changes in power production in the near future (minutes to hours) from wind to solar. “If you don’t see that coming, it can lead to some critical issues when you are trying to balance those loads and maintain system integrity,” says Freedman.
Called the Solar-Wind Integration Forecasting Tool, or SWIFT, the system makes use of a network of remote sensing and point measurements that are being deployed by the Hawaiian Electric Company (HECO). It is a combination of SoDARs, a horizontal scanning LiDAR, and a radiometer. “The radiometer gives you profiles of the temperature and moisture, which is helpful to have when you are trying to make a forecast, especially if you are doing it in Hawaii, where there’s a scarcity of observational data.” To estimate the speed and direction of winds that might be coming in over, say, the next 10-30 minutes, engineers combine data from horizontal scans at distances of 10 miles or more with weather forecasting models.
REAL-TIME APPLICATIONS
Forward-looking LiDAR sensors mounted on top of wind turbines and pointed upwind can measure the speed of the wind that will reach them in the next 2-10 seconds, says Clifton. Unlike data collected for later analysis, this application requires system engineers to couple the data stream in real time with the turbine’s control system.
While it will probably not become standard soon, “longer term, it is something that, as an industry, we are looking at to understand the costs, the benefits, and the implications of doing this,” says Clifton. “As we get more information as an industry, then, possibly, the turbine manufacturers will offer it. NREL is doing a lot of research in this direction. We might also see people putting forward-looking LiDARs on top of wind turbines that are not coupled into the control systems but are being used to measure the performance of the wind turbine. That can be very helpful for warranty purposes and to confirm that the turbine is working as expected.” See Figures 7-8
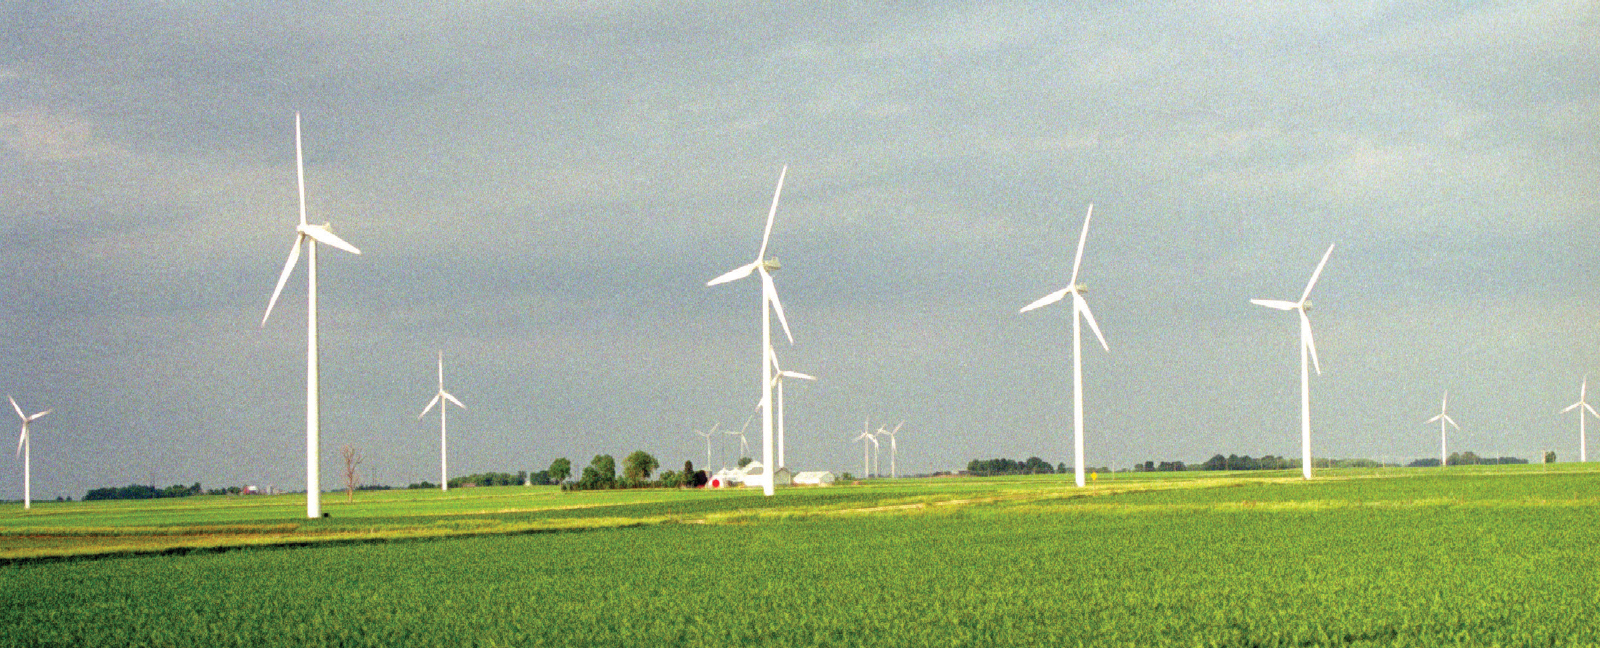
FIGURE 7.
Wind farm at The Cerro Gordo Project west of Mason City, Iowa. Photograph by Todd Spink. Courtesy of NREL.
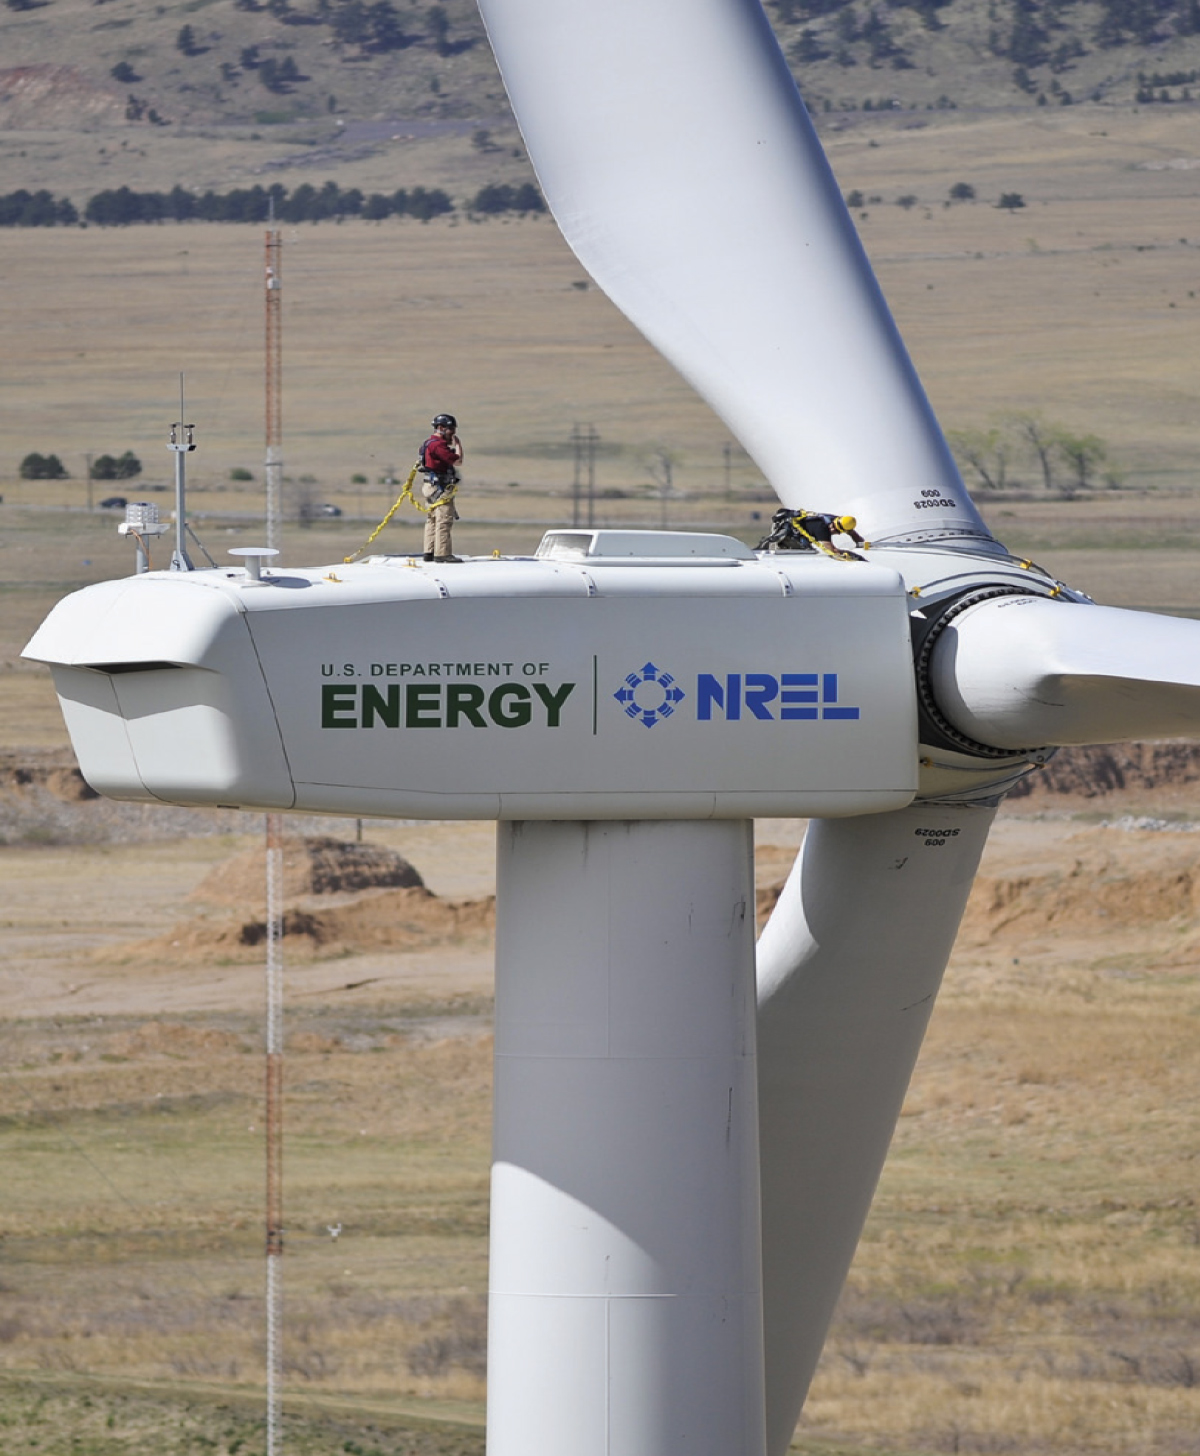
FIGURE 8.
Aerial view of a wind turbine at the National Wind Technology Center. Photograph by Dennis Schroeder. Courtesy of NREL.
MEASURING WINDS OVER WATER
Satellites detect and measure surface winds by using scatterometers to measure wave movement. “The movement of small-scale waves can be correlated with the wind speed at a few meters above the surface,” says Freedman. “They are pretty accurate, probably within a meter or two per second, but it can give you an idea of what the wind climatology is well off shore. Once you get near the coast, the data are more questionable; therefore wind speed observations from satellite scatterometry is typically not really very good within 25 kilometers of the coast. SAR (synthetic aperture radar)does much better and gives a higher resolution much closer to the coast. However, that data is quite expensive and so it is problematic to use it for resource assessment.”
Wind speeds in the Great Plains are very high year- round, while Chicago, known as “the windy city,” is actually not significantly windier than any other U.S. city. Such general knowledge of wind conditions may be enough when choosing a location for a kite store, but the continued growth of wind energy will require increasingly detailed knowledge of local wind conditions in ever more areas of the United States, and around the world.