BY CHRISTIAN HOFFMANN / MARKETING MANAGER
AERIAL, PHOTOGRAMMETRY AND REMOTE SENSING SOLUTIONS TRIMBLE / BIBERACH, GERMANY / WWW.ECOGNITION.COM
Natural resource management in cities is a tough gig. Managers have to plan for the health and longevity of their city’s green infrastructure, while Mother Nature constantly and unpredictably threatens the city’s natural resources. With climate change producing ever more environmental challenges and stressors on cities’ infrastructures, smart strategies for natural resource management have never been more critical for building resilient cities. Fortunately, managers in most cities have access to an untapped resource: Trees. Proven multi-taskers, trees have nearly 350 million years of experience in strengthening urban foundations.

Pittsburgh, Pennsylvania, West End
Indeed, maintaining or increasing a city’s urban tree canopy (UTC) can provide myriad benefits such as improving air quality, absorbing carbon dioxide, lowering the heat island effect, and reducing storm water runoff.
Over the past decade, many U.S. cities with visionary leaders who recognize the economic, environmental, and emotional benefits of trees, have launched ambitious tree-planting initiatives designed 1 to make “green the new grey.” Including the UTC as a strategic part of a natural resource plan is key, but to do so, city leaders and managers must first know the location and condition of their green infrastructure. Trimble’s eCognition® software integrates geospatial imagery and GIS datasets, and analyzes the data to produce land-cover classifications of specific object types such as trees or buildings. These detailed assessments can enable cities to answer the “how much tree canopy do we have” question—core information needed to effectively design smart environmental programs.
MANAGING TREE CANOPY IN BOULDER
One city that recently asked that same “how much” question is Boulder, Colorado, a city that knows a thing or two about being resilient. In April 2016, the city released a Resilience Strategy, which in part, sets out an ambitious climate commitment plan to reduce its carbon emissions 80 percent by 2050. Both maintaining its existing tree canopy and strategically increasing it are two ways to help achieve its goal.
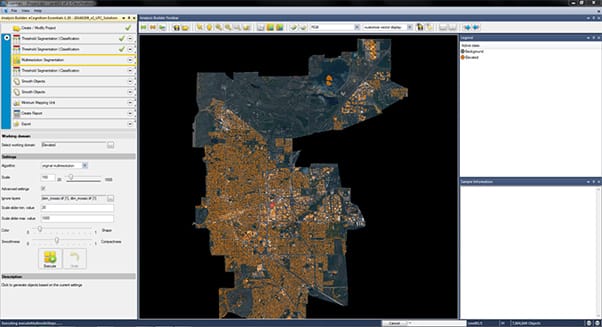
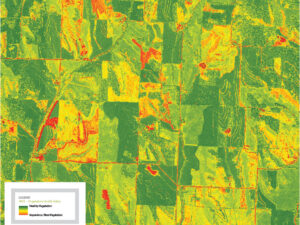
FIGURES 1-3. Screenshots of eCognition, preparing the Boulder UTC
According to the city, Boulder’s urban forest provides nearly $5.2 million in annual environmental, economic and social services benefits to the community, including air quality improvements, energy savings and stormwater runoff reduction. However, its urban tree canopy is also under threat from climate change impacts and the onset of diseases and exotic pests. Of particular concern are Boulder’s ash trees, which make up 20 percent of its urban forest, and are the prime target of the invasive Emerald Ash Borer (EAB) beetle. Due to warming climate, these pests do not freeze during the winter, as they have in the past. The city estimates that 40 percent of Boulder’s ash trees will be infested with EAB in 2016 and, if left untreated, 100 percent of its ash trees will be infested with EAB in 2020.
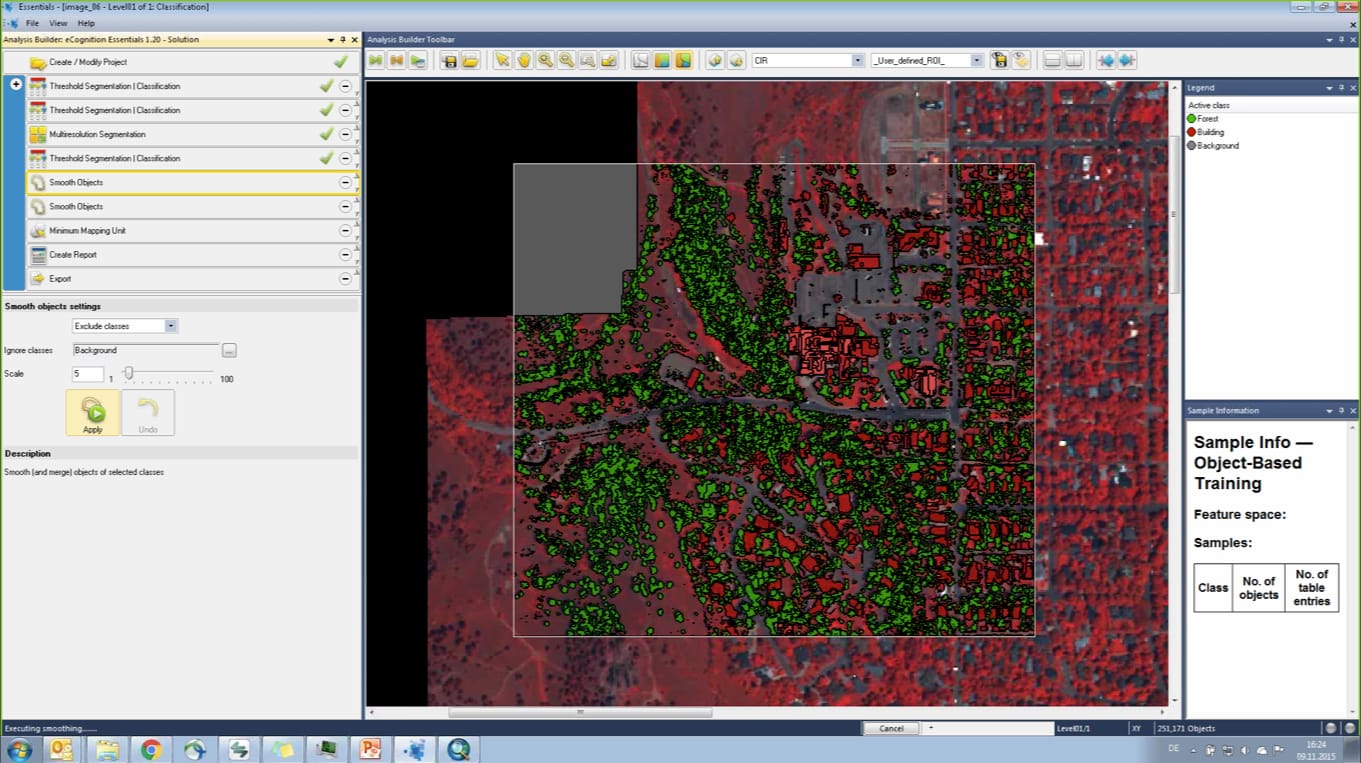
FIGURE 2.
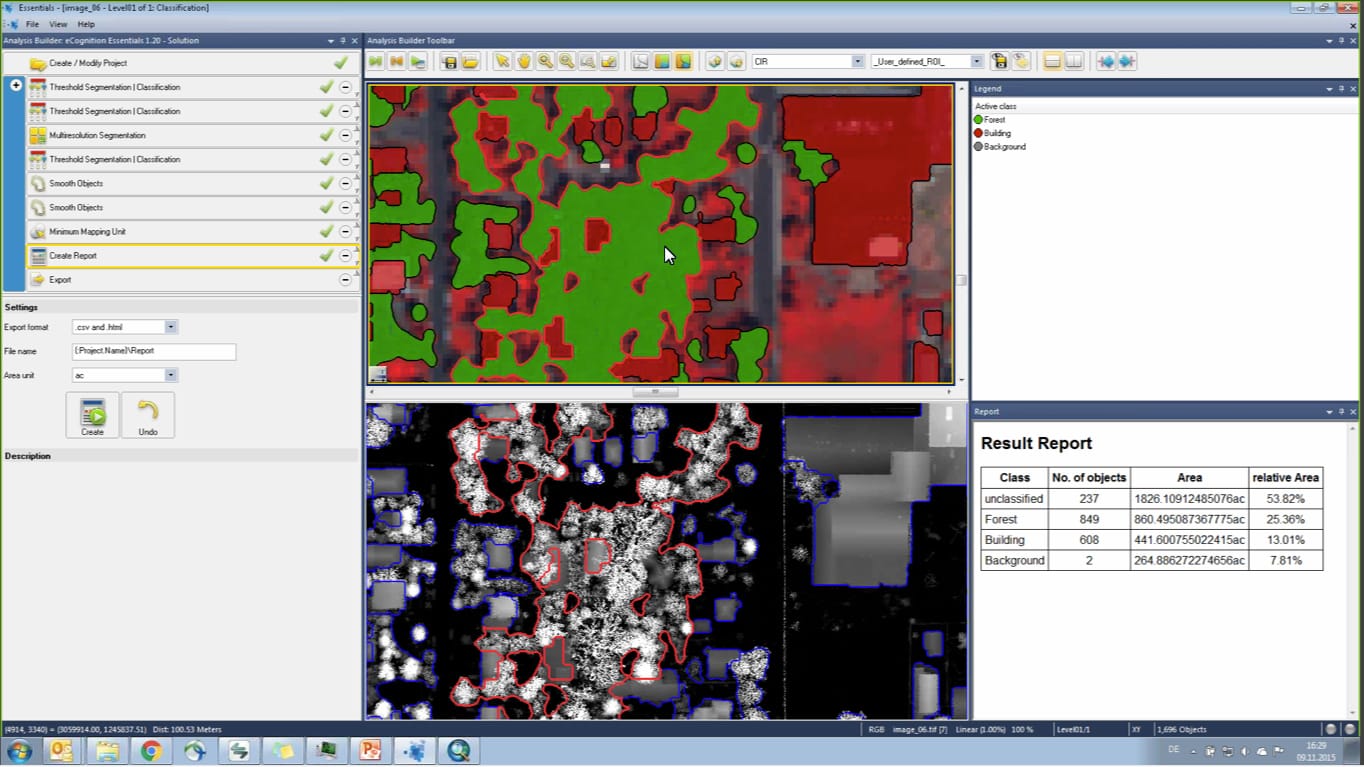
FIGURE 3.
Given these factors and the need to develop a more robust set of urban forest management tools, Boulder partnered with Trimble and DigitalGlobe to determine a baseline UTC—the first step to advancing their tree-canopy development and management strategies.
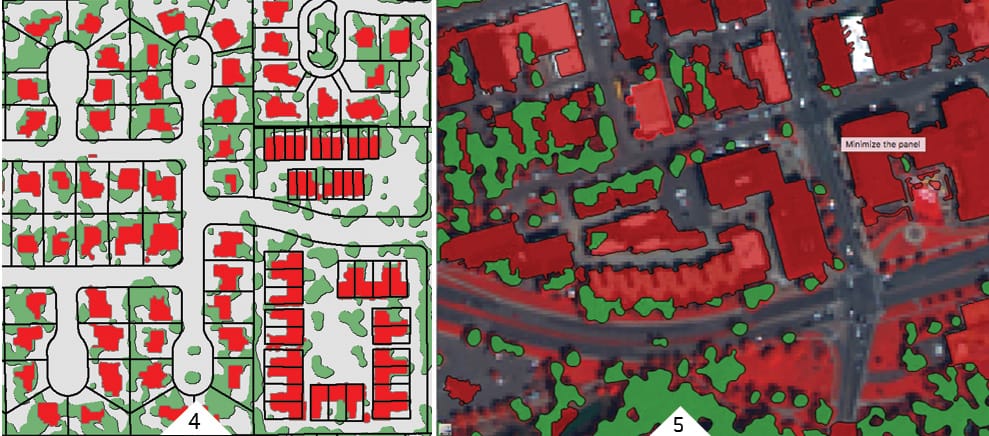
FIGURES 4-5.
Data for Boulder’s UTC
In addition, with the targeted training provided, managers gain the knowledge to create a repeatable image-analysis system to continually monitor and measure the effectiveness of their urban forest betterment plans.
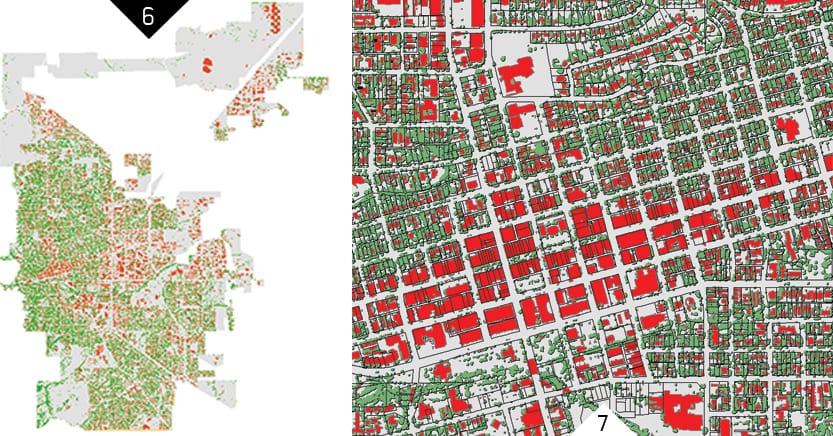
FIGURES 6-7.
Final Urban Tree Canopy for Boulder, Colorado
Boulder is the latest to join a host of other cities including New York, Pittsburgh and Washington D.C. that have also used eCognition to accurately classify and map, as well as continually measure, their UTCs.
NEW YORK CITY
For New York, that critical, visual information enabled NYC Parks’ managers to develop a
strategic tree-planting model to help meet the city’s “MillionTreesNYC” initiative by 2017. With the help of their UTC assessment, managers were able to identify streets and parks with tree deficits, prioritize planting campaigns and plant entire blocks of trees at a time. All of that effort culminated on Nov. 20, 2015, when city leaders planted the MillionTreesNYC initiative’s one millionth tree in Joyce Kilmer Park two years ahead of schedule—adding one million trees to an urban forest that already boasts five million trees.
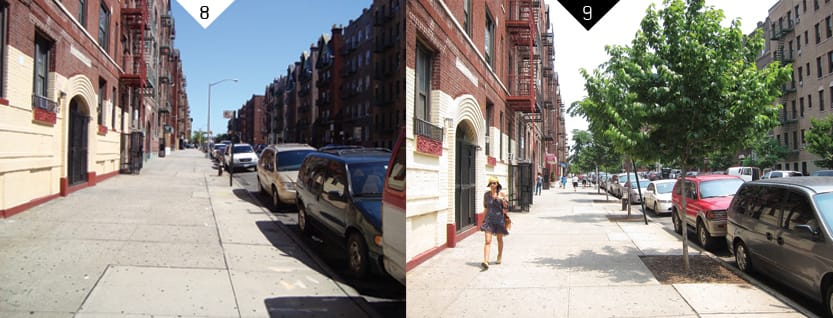
FIGURES 8-9.
Before (2008) and after (2012) photos of NW corner of Post Avenue and Academy, in New York City

FIGURE 10.
Prioritization Block Plan of New York City
PITTSBURGH
Pittsburgh’s UTC analysis has been a boon to Tree Pittsburgh, a local advocacy organization com- mitted to extending the city’s tree coverage by 20 percent in 20 years.
Although Pittsburgh’s estimated UTC is 42 percent—higher than leafy Portland—it is a misleading number because large swaths of trees are on steep hillsides and are not doing the work of reducing storm water runoff and shading homes. The UTC analysis provides the intelligence to help resolve this imbalance.
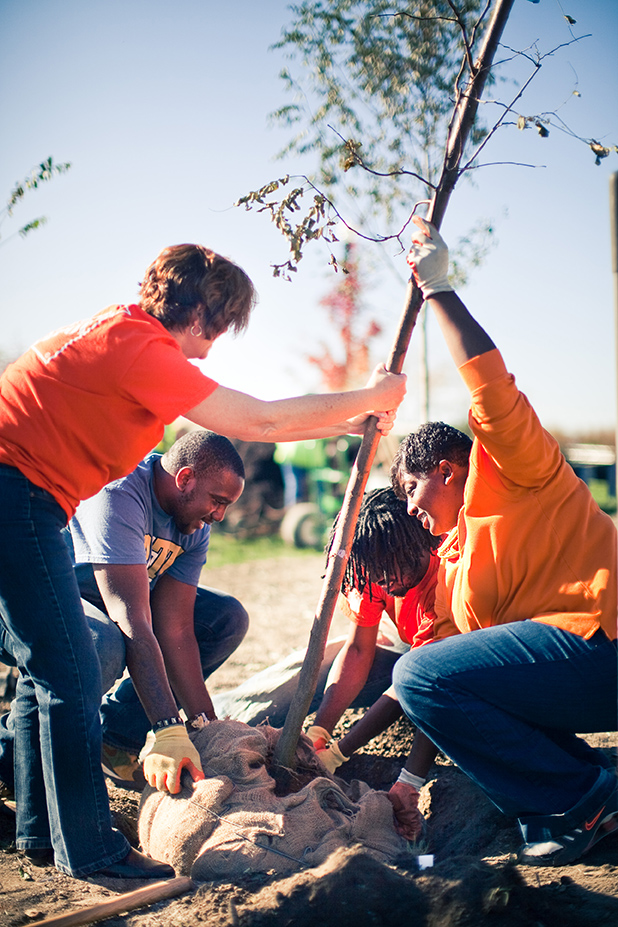
FIGURE 11.
Pittsburgh, friends planting trees, as part of Tree Pittsburgh

FIGURE 12.
Pittsburgh, Pennsylvania Neighborhood Tree Canopy Map
Incorporating the UTC analysis with other tree-related data, Tree Pittsburgh created its urban forest master plan in 2011 to serve as a roadmap to effectively and proactively manage and grow the city’s tree canopy. With such a tool, the organization has transformed their former plant-by-request model into a pre-planned, targeted approach to address tree inequities, as well as to energize public and private groups, businesses and property owners to help blanket the city in green.
WASHINGTON, D.C.
An eCognition-based UTC has also been a core source of intelligence for Casey Trees, a tree advocacy organization in Washington, D.C. that is striving to help the District achieve a 40-percent tree canopy goal by 2032.
From its peak of 50 percent in 1950, the former “City of Trees” has lost 2.5 percent of its tree canopy every decade. Based on the UTC assessment, Washington’s tree coverage is 36 percent, but its impervious surface coverage is 41 percent. The District aims to rectify this inequity.
To achieve D.C.’s tree canopy target, existing trees need to be preserved and new trees must be planted—216,300 total or 8,600 trees annually. Aided by the UTC analysis data, Casey Trees in partnership with government groups, have planted more than 48,400 trees since 2008, and devised maintenance strategies to protect its existing green landscape.
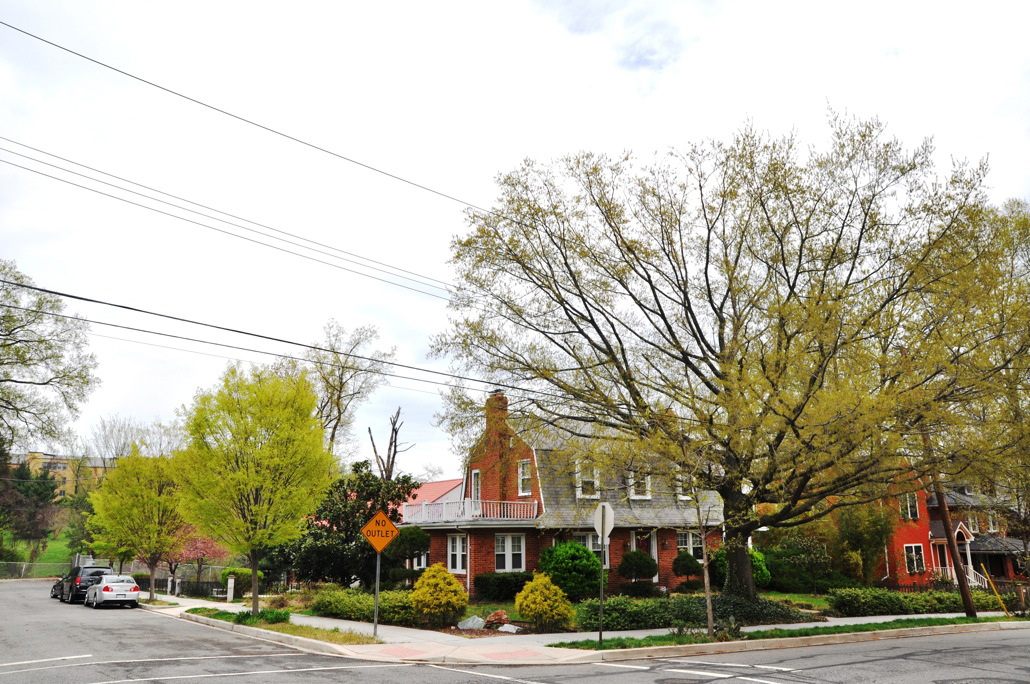
FIGURE 13.
Residential area of Washington, D.C.
Although Boulder, New York, Pittsburgh and Washington D.C. all came to the tree-canopy table with diverse needs and goals, they are united in the benefits they glean from having UTC baselines; UTC baseline data enables each city to continually measure how well their green initiatives are helping them create a more resilient landscape.
Detailed, accurate UTC datasets not only provide planners with the tools they need to devise efficient, tactical greening strategies to maintain and better their canopies; they can help to strengthen the city’s overall resilience against future shocks and stresses. That’s smart. That’s creating resilient cities.