MATTEO LUCCIO / CONTRIBUTOR / PALE BLUE DOT LLC / WWW.PALEBLUEDOTLLC.COM
Companies and government agencies do not buy Earth observation (EO) imagery to decorate their walls, but as a source of information. Efficiently extracting that information from the huge and constantly growing amount of EO data available today—from traditional satellites, cube sats, aircraft, and UAVs—requires artificial intelligence (AI), massive cloud storage, and graphic processing units (GPUs).
For this third installment in this series on geospatial intelligence, I discussed how their companies are developing and using these capabilities with:
Kevin O’Brien, Chief Business Officer, Orbital Insight Shay Strong, Director of Data Science & Machine Learning, EagleViewOrbital Insight
ORIGINS
Dr. James “Jim” Crawford, Orbital Insightís founder and CEO, has a Ph.D. in artificial intelligence from the University of Texas at Austin. He ran robotics at NASA’s Ames Research Center; helped to run Google Books, when Google scanned 20,000,000 books using many interesting applications of AI; then worked at Climate Corp. and was involved in a couple of other businesses.
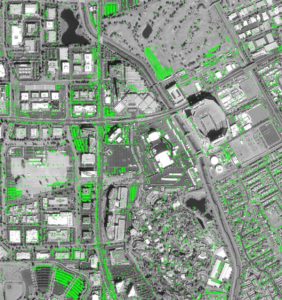
FIGURE 1.
While humans were watching car ads during the Super Bowl, Orbital Insight’s algorithms were counting actual cars as an example of consumer insights. Credit: Orbital Insight and Airbus DS Geo GmbH 2018.
Crawford noticed the very large increase in the number of commercial satellite constellations being launched, the massive increase in capacity and the reduction in cost in cloud storage and computing, and the rapid ascent of GPUs. He had the idea to combine developments in these three areas to build a new generation of geospatial analytics that would be able to process the massive increase in EO data from all the new satellites. “He could have never started Orbital Insight without the power of GPUs,” says O’Brien.
To start the company, Crawford pitched the idea to his former boss at Google, Bill Coughran, who was a partner at the venture capital firm Sequoia, and a week later he had a term sheet of seed funding of about $1.4 million from Sequoia, O’Brien says. “Sequoia has invested in every round that we have undertaken.”
Crawford saw a big market for this kind of approach and no one else doing it. He told Digital Globe, Airbus, and Planet that he wanted to start a new company with a new business model that did not involve selling imagery on a per square kilometer basis as they did. Instead, he asked them to upload a lot of their imagery to Amazon, where he would process it at scale using his new algorithms. He would then deliver the insights he extracted to end users—initially, in the financial services industry and the government—over the cloud, through SaaS-based subscriptions, and pay the imagery providers a royalty. “That is how he started the company,” O’Brien explains.
Crawford recruited engineers from such places as NASA, the European Space Agency, Google, Apple, MIT, and Stanford. “Our company now has more than 100 employees and the vast majority of them are engineers, most of them with advanced degrees and many of them at the Ph.D. level,” says O’Brian. “There are many really smart people in this company.”
FROM COUNTING CARS
TO COUNTING OIL TANKS
Being a humanitarian, O’Brien says, Crawford wanted to use these new geospatial analytics tools to better understand humans’ impact on the planet, protect the environment, and solve key global problems. Among the company’s first customers were The World Bank and the World Resources Institute.
Initially, the company focused on such mundane tasks as counting cars. “It is a major economic indicator globally and it is something ripe to use AI on,” O’Brien says. So, it built a convolutional neural network to identify cars in parking lots, trained its algorithms, took in lots of ground truth data, and continuously revised its computer vision algorithms, using data from Airbus, DigitalGlobe, and some of the other medium-and high-resolution constellations.
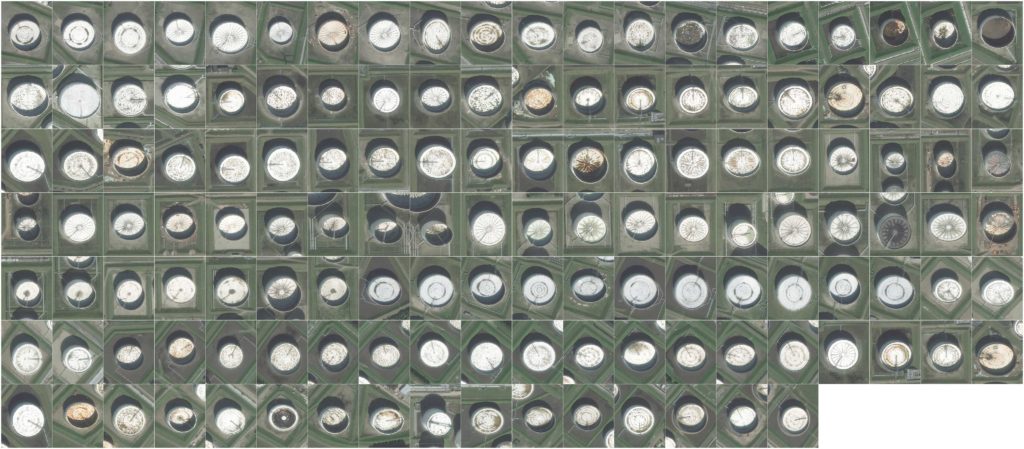
FIGURE 2. Floating lids help gauge oil levels for applications in the energy sector. Courtesy Orbital Insight and DigitalGlobe.
Orbital Insight launched a SaaP-based (Software-as-a-Product) portal product, called Orbital Retail. “We currently track about 100 U.S. retailers, which equates to about 260,000 parking lots across the United States,” says O’Brien. “So, every day and every night, we are taking in loads and loads of new sourcing from our partners, mostly on the satellite side. Then we are running our algorithms and counting cars and linking that back to specific brands and companies.” Their products are mostly used by financial managers for retirement accounts and investment portfolios.
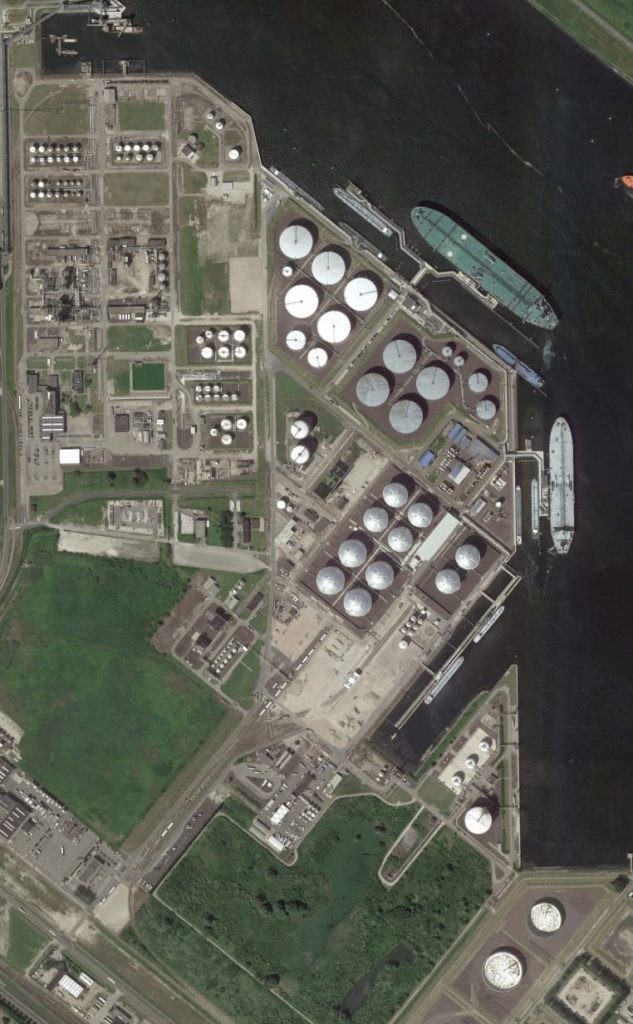
FIGURES 3.
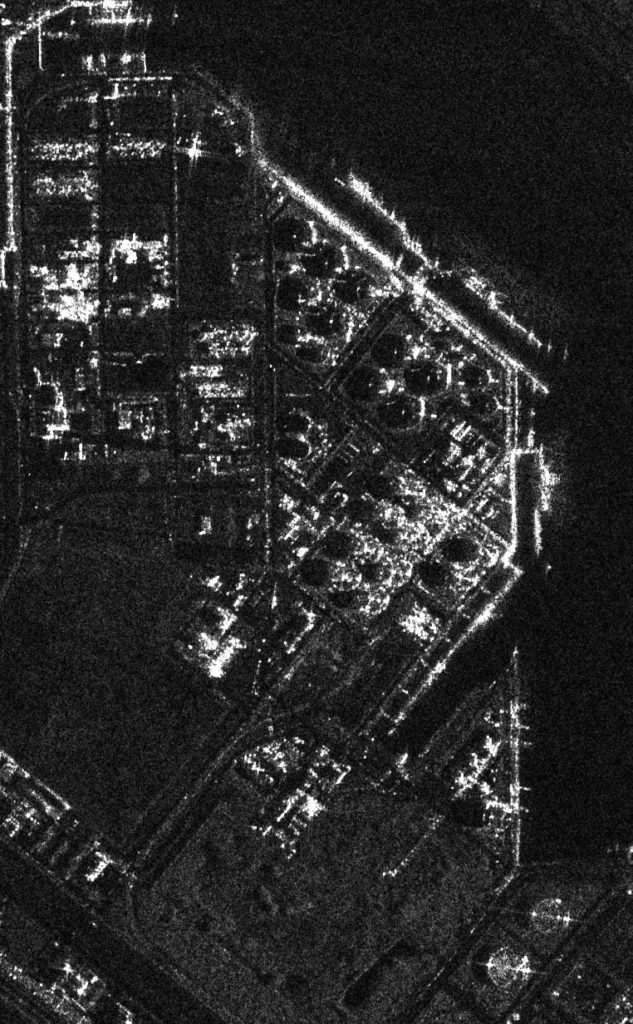
FIGURES 3-4. Ships docked next to an oil tank farm in Rotterdam, The Netherlands. Courtesy Orbital Insight. Figure 3 image from Google. Figure 4 SAR image from RADARSAT-2.
Later, the company expanded to tracking other assets, such as trucks, buses, planes, roads, agricultural products, and oil storage tanks. In the United States, it mapped about 5,800 crude oil tanks. It then developed technology to determine their capacity by looking at the size of the tank’s shadow on the ground and the internal shadow as the floating roof lid rises and falls depending on the volume of oil stored. “We developed a very accurate U.S. crude oil storage product that correlates to the EIA (U.S. Energy Information Administration), which is the benchmark, both in the United States and internationally,” says O’Brien. It then extended that portfolio to cover about 24,000 tanks globally, including across the Chinese market. “That’s important for oil traders, people in the supply chain, governments, and policy analysts.”
The company is now focusing on specific areas where it believes that new analytics can make a major impact, such as commodities—who is producing what type of products, services, and infrastructure— and critical infrastructure assets.
Orbital Insight trains its system to a point where it has high confidence in it, then lets it loose and trusts what it returns. However, it also performs ground truthing. “The optimal end state is that we test it so much that we just turn it on and it just works. But we have a very high Q/A component here,” O’Brien explains.
PRODUCTS
The company currently offers three subscription-based products—Orbital Insight Consumer, Orbital Insight Energy, and Orbital Insight Agriculture—that its clients use to identify new investment opportunities, manage risk, reduce operating costs, and identify new customers. “We are enhancing these offerings with more advanced analytics and work-flow tools that enable our clients the freedom to build their own portfolios,” says O’Brien. Additionally, the company is supporting custom solutions that enable clients to support their specific business cases. “Our platform can be accessed by customers from the cloud or from data terminals via RESTful APIs.
“For our turnkey products, clients can customize their portfolio views and preferences,” O’Brien continues. “With our more advanced workflow tools, clients can easily integrate their own data into the platform. We are introducing imagery but, more so, analytics, to new generations of customers.” These, he points out, are Fortune 500 corporations with capital-intensive problems that can benefit from new geospatial analytics.
“We are set up as a SaaP-based company, so we want to move all of our customers, eventually, to a subscription.” Despite its lower pricing point for small business, the company’s products are not a viable option for local realtors or contractors. However, ultimately, it aims to make its analytics available to everyone, even if “through the back-end of somebody else’s product or application.”
Orbital Insight, which began in financial services, now also does a lot of business on national security applications abroad with the U.S. government, which is the world’s largest customer of geospatial services.
INDUSTRY GROWTH
The geospatial analytics industry has benefitted from the recent explosion in the number of commercial satellites. “As more satellites fly overhead, we receive more frequent imagery of a broader swath of geographies,” O’Brien explains. “The more frequent our imagery, the more accurate and detailed our analytics can be. Having more varieties of satellites—not just optical, but also synthetic aperture radar (SAR), multispectral, etc.—also expands the types of analyses that we can do.” The growth in the number of satellites has also increased the pool of potential customers for their imagery services and helped to spawn more use cases, enabling the satellite companies to reach new customer segments. “We are rapidly developing new use cases and analytic tools to support a growing list of clients.”
Geospatial analytics provide asset managers with new ways to identify investment opportunities, monitor their investment portfolios, and manage risk. Recent examples for Orbital Insight include analyzing the performance of a set of retailers to compare their performance with regards to a specific brand, monitoring supply chains to predict the performance of two manufacturing firms, and determining utilization rates of certain mining locations across the globe.
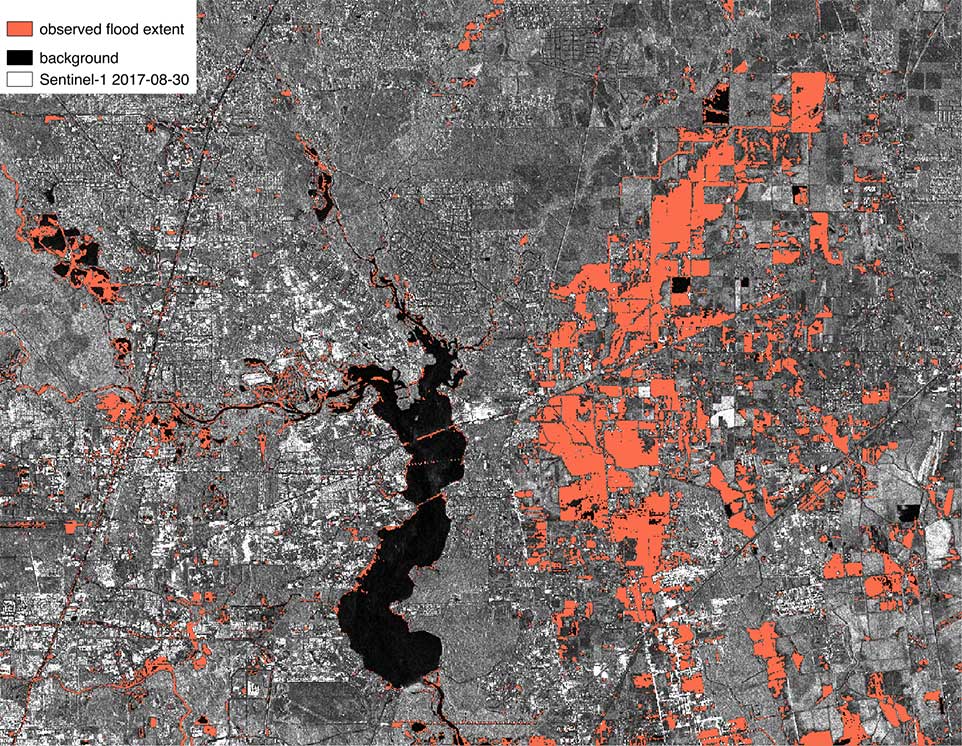
FIGURE 5.
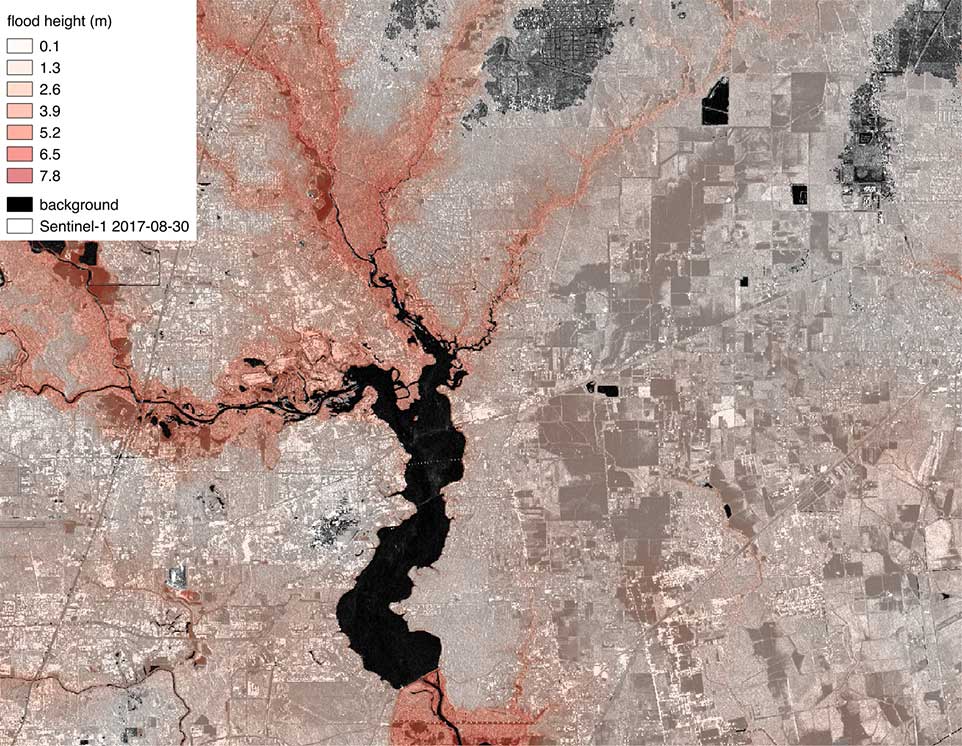
FIGURES 5-6.
Hurricane Harvey flood maps near Lake Houston use 5-meter resolution stripmap SAR images from Sentinel-1, a DEM from the National Elevation Dataset, and a watershed shapefile from the Texas Natural Resources Information System. Figure 5 is observed flood extent; Figure 6 is derived flood height.
“Another example is the World Bank, which is exploring how geospatial analysis can supplement infrequent census data to better map poverty in rural areas,” says O’Brien. “Analyzing signals such as building height, building density, car density, and agriculture has shown promising results when used to map poverty. We’ve worked with the World Bank on projects in both Sri Lanka and Mexico.”
When Hurricane Harvey struck Texas in 2017, the company began to measure peak flood extent by using a combination of different types of satellite imagery (such as optical, SAR, high-, and medium-resolution), digital elevation maps (DEMs), and topographic maps. “We processed the imagery to get the fullest map possible of areas that had flooded, and then used the topographic maps and DEMs to understand where water would have spread in areas for which we might not have imagery,” says O’Brien. “This type of analysis could be useful for policymakers, first responders, insurance companies, and others.”
PARTNERSHIPS
“If anyone is flying satellites right now, we know them and they are most likely contracted with us,” says O’Brien. “If people are planning on launching, we already know them, too. If people are even remotely thinking about launching satellites, we have probably talked to them as well. DigitalGlobe was our first partner and they have been super-helpful since the day we started. We know the Airbus folks really well. We work very closely with Planet, UrtheCast, SIS out of Korea, ImageSat out of Israel, and e-GEOS out of Rome.”
“We’ve expanded into SAR, we are working with lidar and aerial, we have already begun testing on different drone platforms, to look at more of a future capability,” says O’Brien. The company also sees opportunities to leverage other forms of geospatial data, such as from IOT devices or other terrestrial-based sources that it can blend with satellite data.
EagleView
ORIGINS
Shay Strong, EagleView’s Director of Data Science & Machine Learning, has a Ph.D. in astronomy from the University of Texas at Austin and worked on radiative transfer modeling of gas giant planet atmospheres in our solar system. Right out of graduate school, she joined John Hopkins University’s Applied Physics Lab, where she developed various instruments and some infrared technologies for a variety of defense and civilian spacecraft, conducting many field tests. After about seven years, in 2014, she joined OmniEarth, which was later acquired by EagleView. “I was ready for something new and I had some friends and co-workers who had joined Lars Dyrud as part of this start-up,” Strong recalls. Dyrud is now Senior VP of Machine Learning at EagleView.
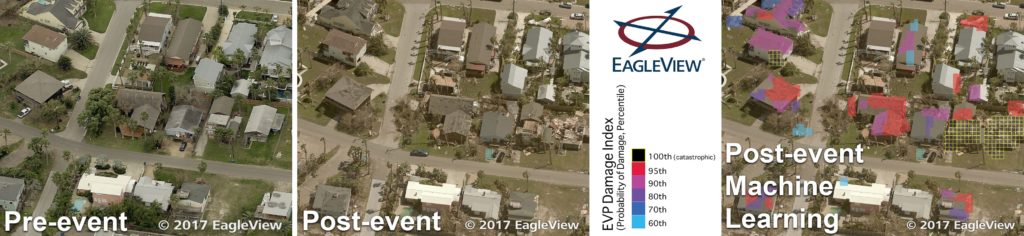
FIGURE 7.
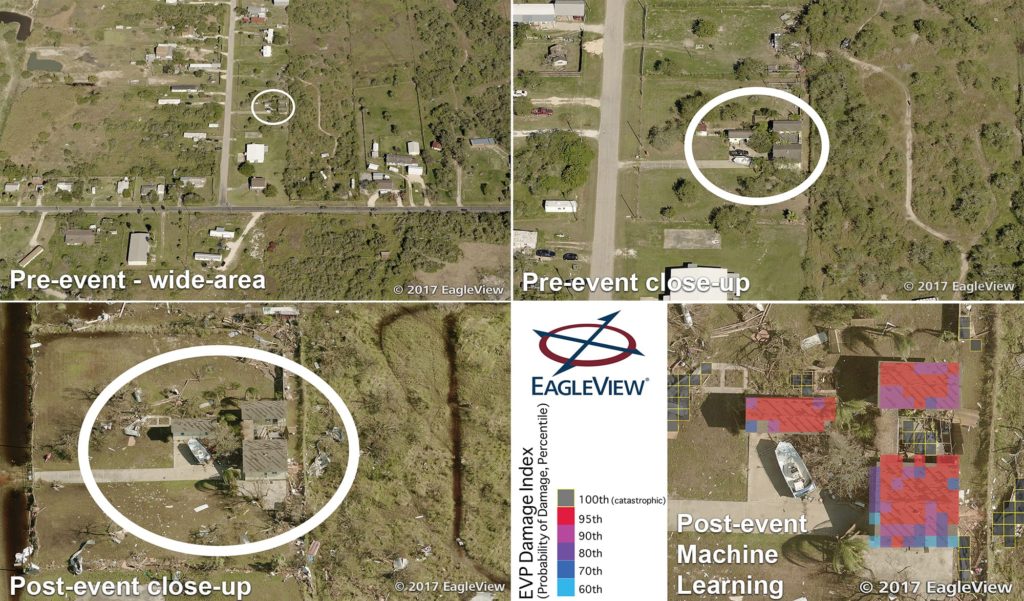
FIGURE 7-8. Following a disaster, EagleView can quickly compare pre- and post- event images and create a prelimi- nary assessment of the damage. Figure 8 shows the assessment following Hurricane Harvey in Houston, Texas, August 2017. Courtesy of EagleView.
Initially, Strong says, OmniEarth was established to develop nanosatellites to image “everywhere, every day.” However, early on the company realized that, while there was a huge amount of competition to acquire EO imagery, very few people at the time were focused on analytics. “We were independently developing that while also pursuing the satellite hardware side of things. Then it was the analytics that really took off.”
In 2016, OmniEarth decided to focus solely on the analytics side. “That evolved initially from classical machine learning, but then ultimately moved up to deploying neural networks and AI algorithms on a variety of imagery collects (e.g. satellite, aerial, and ground-based). The timing worked really well in terms of where the industry was going.”
One of the company’s first products was a predictive analytics solution for water agencies, predominantly in California. It collected petabytes of imagery every year (initially satellite imagery, then also aerial imagery from partners, including EagleView), input them into convolutional neural networks for semantic segmentation, combined it with weather information, and produced automated land classification maps for each season. It was then able to provide address-level predictions of water usage that water agencies used to identify and target extreme over-users. “This was really timely with the draught restrictions in Southern California,” says Strong.
Scaling these analytical capabilities on massive imagery sets, Strong recalls, required using deep learning AI and building a cloud infrastructure— abilities that motivated the company’s acquisition by EagleView, which now uses the technology to serve its long-time insurance customers. “So, the technology is predominantly the same, but the problems base and the customers at the end point are a little bit different for us.” Currently, Strong’s team consists of about 12 people who are geospatial analysts, astronomers, software developers, data scientists, and project managers.
ROOF REPORTS
EagleView, which has a fleet of about 115 aircraft, has invested heavily over the past couple of decades in developing sensors to acquire oblique and nadir imagery at very high resolution. Through the acquisition of OmniEarth, it now also has a great deal of experience in satellite applications. “We are using some of the satellite imagery, such as DigitalGlobe’s, which has a coarser resolution than aerial data, on the order of .3 meters or so, to do some slightly different flavors of work, so that we can scale some of our responses and services for the insurance customers,” says Strong.
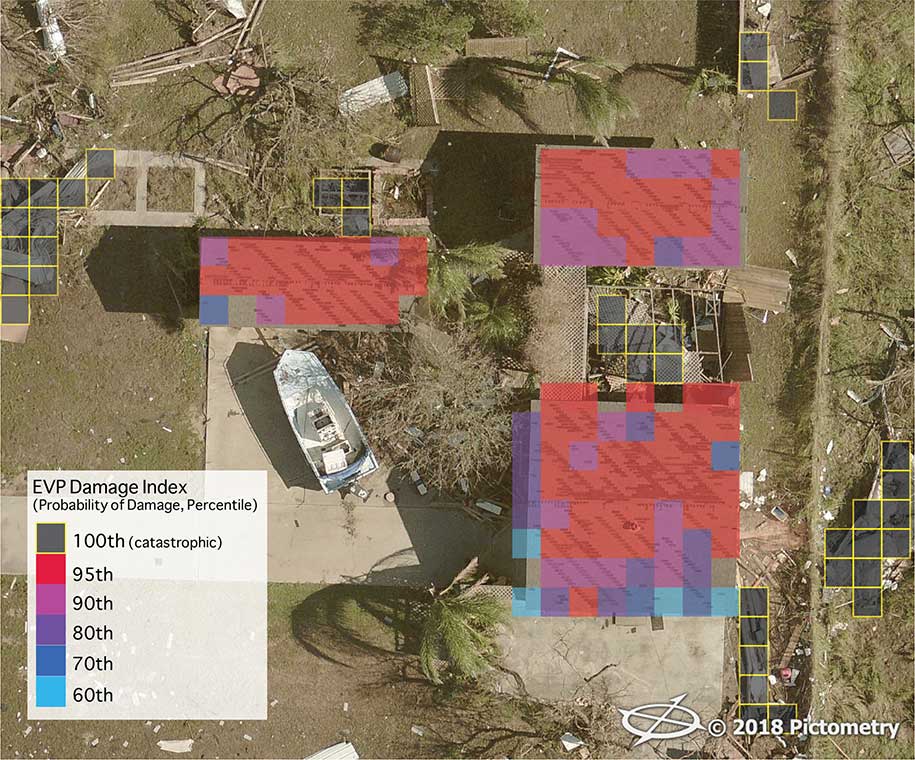
FIGURE 9. Detail of Hurricane Harvey EVP Damage Index, courtesy of EagleView.
While high-resolution aerial data is “fantastic,” Strong points out, its acquisition and processing is expensive and can be limited by airspace issues, such as flying restrictions during hurricanes or massive wildfires. “The beauty of satellite imagery is that it is persistent and often we can provide the coarse mapping of severe property damage and storm damage to the insurance providers ahead of the aerial acquisition.”
For nearly two decades, EagleView’s core product has been its roof reports: high-resolution imagery of individual properties with very accurate measurements. “Essentially, think of a 3D wire frame of a house, with all the walls and the roof and all of those key components labeled and accurate,” says Strong. Part of her team is responsible for automating that process using AI. It is also developing new capabilities for drone- based analytics for EagleView’s OnSite program, which deploys drones for insurance customers to collect hundreds of images at addresses that have suffered damage or need inspection. “My team is responsible for developing the models, spinning up the cloud infrastructure for processing the imagery that comes back, and annotating the individual images.” Additionally, the team obscures all personal identifiable information, such as faces and license plates.
Another big effort for Strong’s team is to deploy stormAI, which is focused on fast response for catastrophic natural events, such as fires, hurricanes, and floods. “We developed some models that can ingest satellite and aerial imagery at multiple resolutions and provide quick turnaround spatially resolved maps of where various degrees of damage have occurred,” she says. Additionally, EagleView’s petabytes of imagery collected often multiple times a year at a resolution of less than 3 inches enables it to categorize every single attribute on individual properties. “Our AI can deter- mine pools and solar panels and roof condition and architectural features. We are developing a nationwide database with time-series information on individual properties.”
FUTURE DEVELOPMENT
EagleView’s system constantly trains on imagery to improve its feature extraction and change detection algorithms. It consists of a single cloud-based architecture with many flavors of AI models, Strong explains. “AI is beautiful in that it can be incredibly robust, especially given a huge amount of training data for supervised applications.”
While her team is “100 percent AI all the time,” the company also needs to maintain and improve its established product lines. EagleView typically uses imagery at 3-inch resolution to extract property attributes for its nationwide database. It also has sub-1-inch imagery, which it calls ultra-high resolution, that it uses to gather information on such things as roof damage.
The key challenge to further development of AI, Strong argues, is building “a sustainable, agile pipeline.” It will also require developing neural network-based or reinforcement learning capabilities that need less and less supervision and training data to learn. “At some point, you wouldn’t need any supervision or examples of what you were looking for.” For example, an algorithm could cluster images of swimming pools based on certain characteristics, even though it does not know that they are called swimming pools. “The algorithms have essentially determined what a pool is.”
This year and the next, Strong predicts, the development of open source capabilities for automated driving will greatly improve AI to analyze video in real-time.
CONCLUSION
The amount of training data is growing exponentially, with the increase in the number of satellite-based and UAV-based sensors; GPUs are now commonplace; and automatic feature extraction algorithms are getting smarter by the day. The next challenge is to ask the right questions to extract the most insight about our rapidly changing planet.