 Geospatial solutions need a shift in focus to reach the next level of acceptance and impact for disaster relief. What has been applied to incidents in the immediate aftermath of disasters can be strengthened. The solution brings new partners to the table, extends the timeline for use, focuses less on display and more on the listener, and attends to the private and public understanding of location-specific situational awareness tools, and how to use them appropriately. Interestingly, the path to success is defined by what is missing: the partners, the later stages of disaster, the connections with those who can truly respond, and more informed use by both expert and public alike.
RE-DEFINING THE PARTNERS
Let’s look at the partners who typically engage in disaster planning. Well engaged are the professional emergency management officials, various government agencies responsible for response, and a range of sophisticated planners, many with powerful scenario modeling tools. In addition, technical and software vendors contract and contribute their expertise in what can be measured, displayed, and analyzed. Who is missing at this table? Missing are those who spontaneously organize, the charities, faith-based groups, the voluntary agencies, the other citizen groups who collectively bring most of the volunteer hours, and a great deal of the long-term recovery capacity.
These organizations are also the least likely to have the resources to participate in planning exercises. They are the same entities, however, for which geospatial tools can change the calculus of their engagement.
The same agencies that rarely have sufficient discretionary resources to engage in disaster or emergency planning are the same entities that know they need to do a better job analyzing the gaps between the location of their resources and the location of their clients. Moreover, these same organizations work every day to help those in need by managing a tremendous inventory of community-based resources. Many of these are the same resources deployed for long- term disaster recovery. By helping to map day-to-day resources for these less engaged organizations, emergency and disaster professionals gain access to critical information about community assets that can be used in response and long-term recovery.
By organizing information for NGOs and others who help the needy in communities every day, those with geospatial expertise change the calculus. With the promise of better analytics for everyday operations, these NGOs can justify their involvement, will be more willing to share data, and will almost incidentally contribute their knowledge of local assets and resources for the purposes of emergency planning. The approach? Consider stepping out of the emergency management silo and simply approaching the NGOs with the offer to use disaster planning tools to help them analyze the proximity of their resources to their clients. Build on that simple offer, and as the work progresses, then, and only then, take the step to connect the dots between everyday operations and emergency response. Working together you will increase the resiliency of every partner at the table, but it starts with attending to everyday needs, not the needs of the occasional crisis.
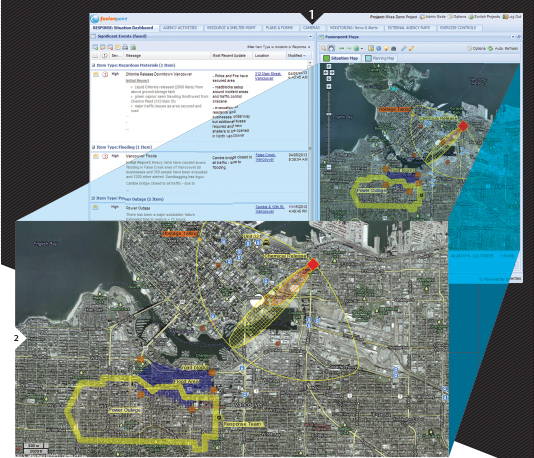
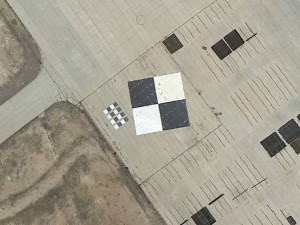
FIGURES 1-2.
The Fusionpoint Situational Dashboard and Map are examples of how disparate data sources can be layered together for effective disaster incident response. Courtesy of Fusionpoint, powered by Emergeo (Vancouver, B.C., Canada).
RE-DEFINING THE FOCUS
As more partners are engaged, re-defining the targeted phase of disaster recovery is next. Typically, disaster analytics are focused on the period immediately before a catastrophe (as with, for example, water- level monitors), immediately after a disaster (as with impact or evacuation boundaries, and mobile kitchen and shelter locations), or on the metrics of need (as in block-by-block surveys of damage.) Consider, however, focusing the power of situational analysis on the later stages of disaster recovery. Admittedly, this focus is not as immediate, nor does it satisfy the need for real-time insight as a large-scale disaster unfolds. Let’s consider the curve of expenditures after a disaster. Immediately after a flood, hurricane, or forest fire, for example, substantial resources are deployed to feed and shelter survivors, to conduct search and rescue, and to assess the damage. Once this stage winds down, however, then the rebuilding begins and the sums of expended resources increase substantially.
“Geospatial systems are not able—on their own—to filter for quality data as the wise expert does intuitively.“
Said another way, when the news cycle dies down about any disaster, recovery has barely begun. The power of geospatial tools, by the visual nature of the medium, can help extend focus and attention on the less dramatic but very real long-term work that lies ahead. Months after the impact of Hurricane Sandy, thousands of people still had no home to return to and no affordable permanent housing option. Information about the clustering of these homes, the status of recovery, and information about specific needs could all be easily communicated to help coordinate assistance and engage donors.
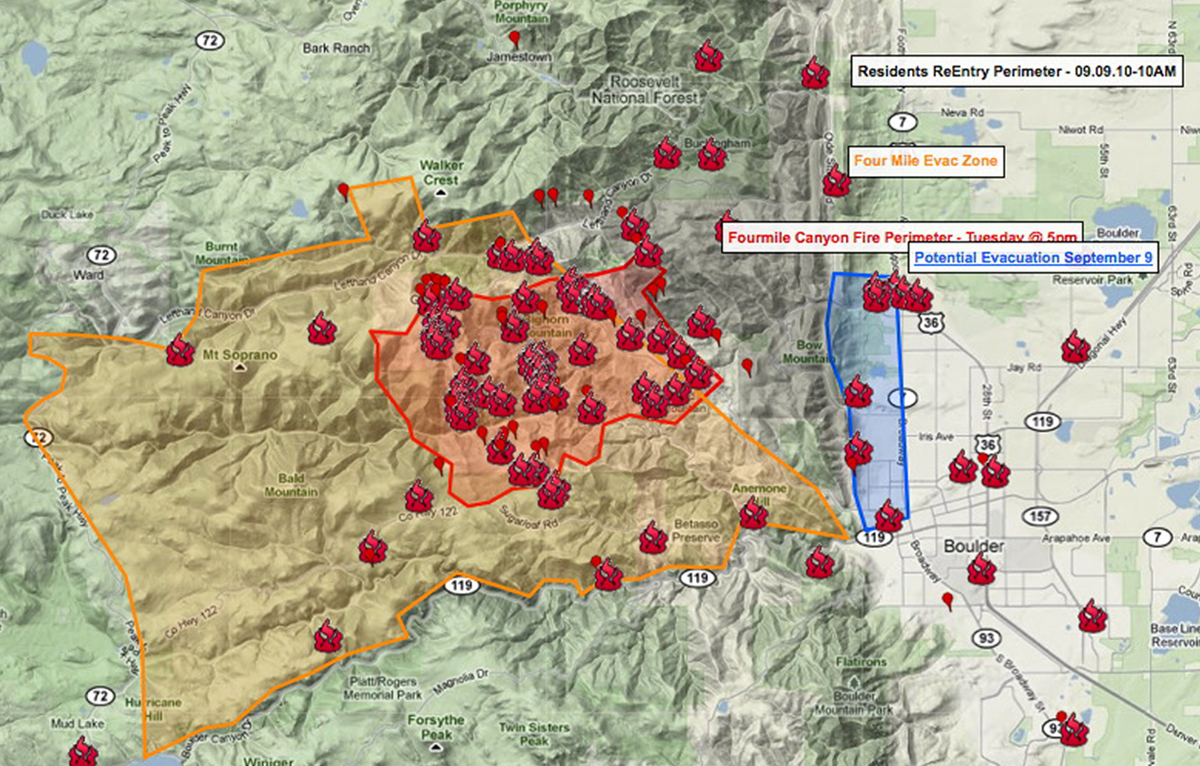
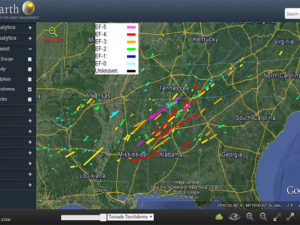
FIGURE 3.
During the surge of large-scale fires in Colorado during 2010, joint operation situational maps successfully combined social media (vetted and non-vetted), public data feeds, and professional disaster data for a more comprehensive situational map. This particular view focused on the fires in the Boulder, Colorado area where burnt structures were reported by the public via social media and verified by disaster responders.
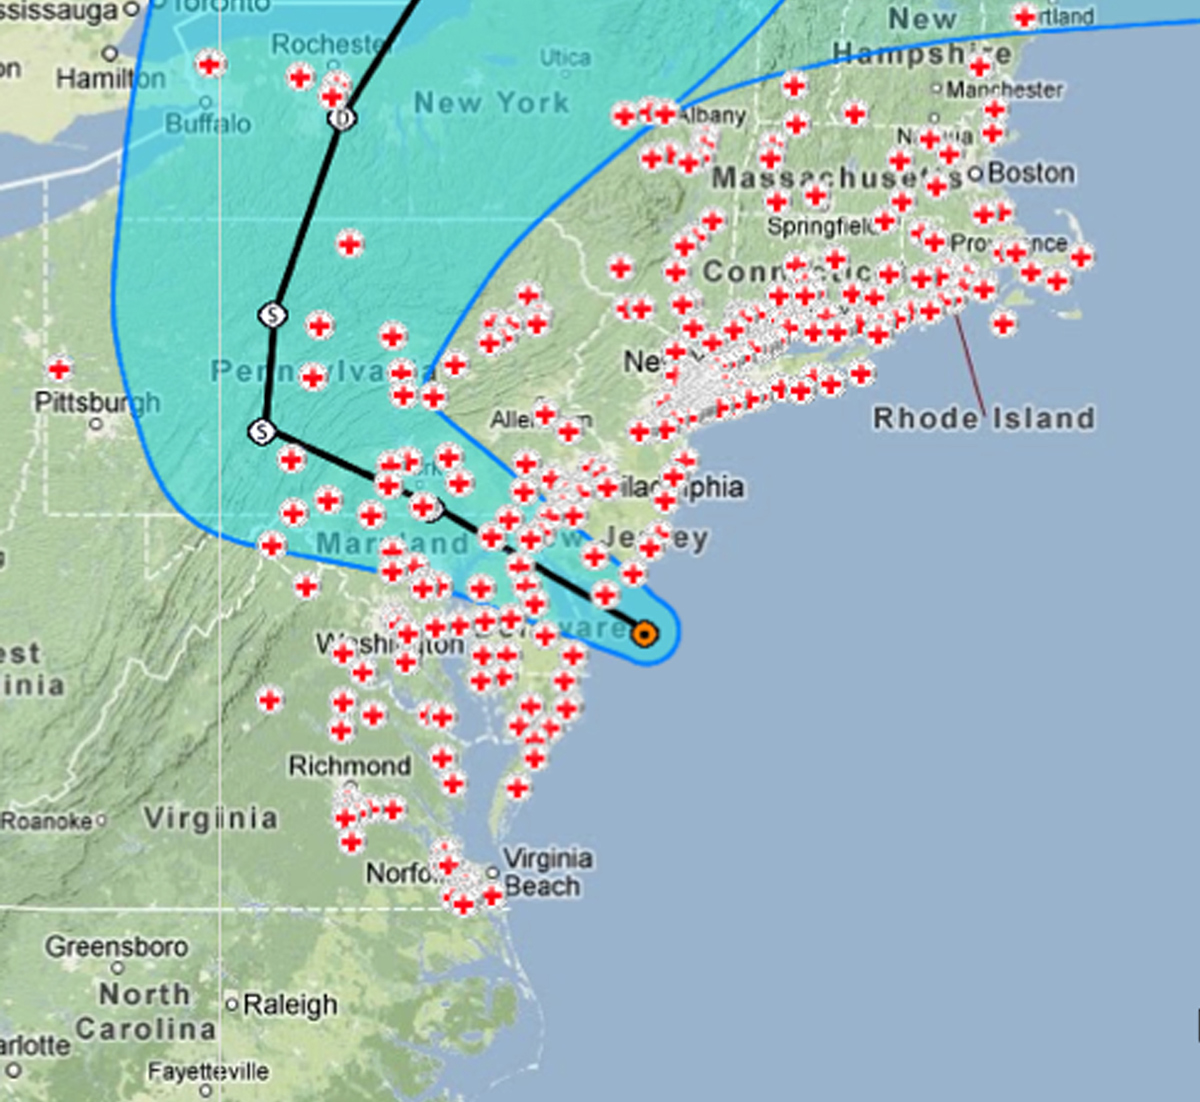

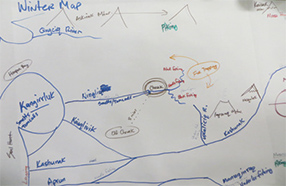
FIGURES 4-5.
During the recent impact of Hurricane Sandy, situational maps for both public and professional consumption leveraged data sources for weather, regional power grids, the National Shelter System, and social media to provide a more comprehensive view for disaster responders. Additionally, professional responders can then plot locations and current needs of disaster victims and currently available resources to facilitate better allocation of support resources.
WHO IS LISTENING?
Depending on the locale, some situational awareness tools are still being used in pilot or test mode. Some systems are still proving themselves, and in that mode, beginning to use the tools is often more important than using them well, or as fully developed as will be eventually possible. As these technologies mature, however, professionals and the public alike need to ask whether anyone is listening.
The key question is whether or not the solution is linked to any entity who is listening, and also able to do something with the information.
The most elegant display, the most articulate laying of data is all for naught if there is no organizational capacity on the other side to do something with the information. In fact, false expectations can be raised among those who can “see” all the data without understanding the logistics of response and recovery. Now that geospatial solutions are well proven, the efficacy of their use will be determined less by the pace of advances (which are already ahead of most audiences) and more by the linkages between the data and the decision-makers (particularly at the middle management layer) who need to act on the data.
Many disasters have received careful and well meaning attention from numbers of volunteers who have stood up tremendously useful mapping solutions, often within hours or days of the incident. The efficacy of that work will be determined, however, not by the depth and dimension of the data, but by the degree of separation between the new mapping solution and the previously established entities that are formally chartered to respond to disasters. Yes, geospatial solutions needed to prove themselves first. Yes, there will be even more amazing advances in the technology. Now, the barrier to efficacy is not, however, the technology. It is the link between data, display and decision maker. Those are the dots that need attention now.
A NEW KIND OF EXPERTISE
Ask a gathering of disaster professionals about their own leaders, or their own expertise, and most will mention a highly respected senior member of their group who “has forgotten more about disaster relief that most of us will ever know.” These senior members are often said to have a near-perfect gut level understanding for the ebb and flow of disaster response. This is an expertise borne of years and years of field-level experience, a vast network of trusted relationships, and a gritty sense of the real world. Geospatial solutions can interrupt the decision making of such wise elders. Why? Because many of those with highly trusted expertise are not those willing or able to accept the insights of new real-time situational analysis systems. Or more specifically, geospatial systems are not able—on their own—to filter for quality data as the wise expert does intuitively.
Conversely, geospatial tools can display so much information, quickly and elegantly, that less experienced decision makers may weigh the wrong data too heavily, or may not rely sufficiently on reports from the field, or may treat all data as equally valid. The result can be poor decision making at the worst time.
The solution is resource intensive. Tabletop and field exercises become more important as the task is not only to work the problem towards a solution, but to work the problem with entirely new sets of data flows never before available. This is the story of all new technologies and adoption curves. With disasters, however, quantity and quality of data are nearly always inversely related.
The public also needs to become more aware of how different sources of data are interpreted by their local officials. As an example, when the American Red Cross surveyed more than 1,000 adults about the use of various social media sites in 2010, 35% responded that they would post a request for emergency assistance on the organization’s Facebook page, and 28% said that they would send a Twitter message directly to the relief organization.
In VisionLink’s work, we use a social media feed from GNIP (Boulder, Colo.), a worldwide leader in social media data aggregation. We do so because if our disaster relief customers such as the Red Cross need to review Twitter feeds for distress calls, we need to be capturing every single relevant tweet, not a sample of those tweets. The challenge is then three-fold. Experienced disaster relief professionals need to add to their network of trusted relationships a nuanced under- standing of data sources, reliability, quantity and quality. Geospatial experts can focus less on the pace of improvement, and more on connecting the dots between data systems and authoritative relief agencies that are resourced well enough to respond at scale.
“Now, the barrier to efficacy is not the technology. It is the link between data, display and decision maker. Those are the dots that need attention now.”
PARTNERS, FOCUS, NEW EXPERTISE
The leading edge of geospatial technology is exciting and inspiring: true.
The efficacy of its application will be determined going forward however, by much more mundane needs. Let’s find ways to engage the community agencies and the various NGOs that service the community day-to-day. Focus on the long-term, multi-year needs of recovery, not only the flash of incident management. Make sure that the organizations that control the resources of recovery are actually linked to, and “listening” to these amazing tools.
Finally, take on the challenges of adding geospatial solutions to the trusted toolkit of the experienced professional, of the limits of real-time data for those new to the profession, and of public awareness about appropriate and inappropriate channels of communication.
Geospatial platforms are not simply ways to inform professionals; they have an inherent capacity to inform and educate a wide range of skate holders. It is time to move beyond prototypes and pilots, becoming the tool of choice as communities rebuild after disasters.