The executive director of an international nonprofit organization needs to map all the hospitals, clinics, and first aid facilities in Ecuador, Colombia, and Venezuela that are within five miles of elementary schools.
An entrepreneur is researching the market for laundromats in low income areas in mid-sized U.S. cities. A State Department diplomatic security agent wants to map the police stations and military bases that are within a 20 minute drive from U.S. embassies and consulates in 17 Middle East countries. All three face the same challenge: finding a comprehensive, reliable, up-to-date database of geo-located points of interest (POI) that they can import into their geographic information system (GIS) and analyze. For each project they can find hundreds of relevant database on the Internet-but of these sources, if any, will meet all of their requirements. The creation and analysis of geospatial data by individuals and non-government organizations (NGOs)— commonly known as crowdsourced data—has exploded in the last couple of years, dwarfing the amount of information in government databases and proprietary commercial systems. While massive, however, these troves of data are often not sufficiently reliable and accurate for uses such as the ones in the examples above. Moreover, it is challenging to make sense out of disparate sociocultural data, collected by a multitude of systems, for different purposes, and at different levels of specificity. Enabling users to rapidly gain understanding of their regions of interest requires fusing these non-standard data sources into consistent datasets. Data about the location of human activities falls under the rubric of human geography, but is also referred to as “human terrain” or “human landscape.” In recent years, as the collection of this type of geospatial data and the ability to store it and analyze it have grown exponentially, so has demand for it, and several companies have entered the market to provide it. Among them are DigitalGlobe, a satellite imagery company now focused on providing customers with information, and Spatial Networks, a geospatial technology company.
ORIGINS
DigitalGlobe began its Human Landscape project about three years ago. The company was already compiling geospatial analytical products that included a lot of human landscape information. “We were finding that our analysts were spending a lot of time gathering the data and getting it into the right format so that they could do the analysis,” recalls Alex Dunmire, DigitalGlobe’s SOCOM/CENTCOM Program Manager. (SOCOM and CENTCOM are the U.S. military’s Southern Command and Central Command.) “So, we came up with the idea that we could independently build the human landscape geo-spatial products to help us speed up the analytical products when we got to them. Instead of geospatial analysts spending 60-70 percent of their time gathering geospatial data, verifying it against different sources, and getting it into the right formats, if the data was already there, they could go right into doing the analysis. We’ve built these datasets for more than 50 countries.” Anthony Quartararo founded Spatial Networks in 2000 to conduct strategic research and provide competitive business intelligence, using geospatial technology. Demand for human geography data has rapidly increased over the last several years, he points out, “particularly when it comes to the high fidelity data about what people do, where they do it, and why they do it. That is the essence of human geography and we are in that market.”
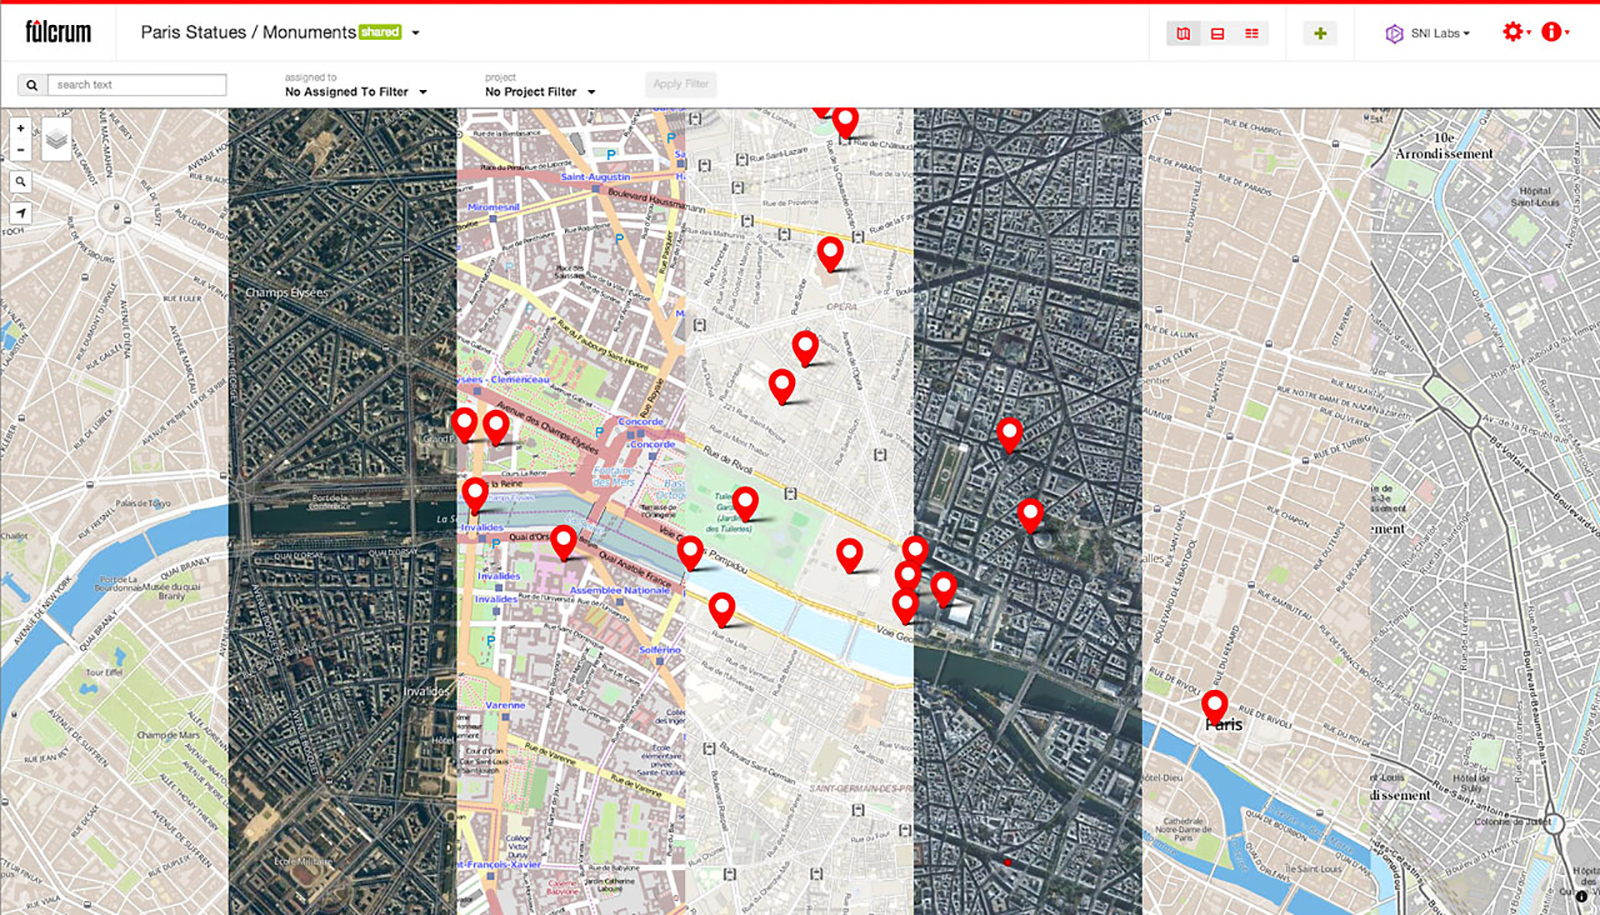
FIGURE 1.
Example of map of Paris, France, with several layers and data sources, on Fulcrum. Courtesy of Spatial Networks.
CAPABILITIES AND PRODUCTS
Compiling country-wide geography datasets is difficult, Dunmire argues. “You have to go to numerous Web sites, publications, analytical books; some of them are in a different language. Pulling all of this geospatial data together takes a lot of focus and expertise in understanding geospatial data to get it to feed into the predictive geospatial models that we use for analysis.” DigitalGlobe uses the imagery acquired by its satellites to verify the data and to include images with the POIs. This is the company’s greatest strength in the human geography market. For example, to develop the layers for North Korea, it used 131 different sources and produced 16,000 POIs, each with an image chip showing the point on the ground (see below). Spatial Networks is focused on data, analytics, and technology. “We provide raw data and/or derivative products to the U.S. federal government, including the State Department, the Defense Department, and the Intelligence Community, as well as to portions of the commercial industry, including the energy market, financial services firms, and futures trading organizations,” says Quartararo. The company’s main technology offering is Fulcrum, a do-it-yourself mobile app platform that allows users to develop mobile data collection apps or forms for use in the field with smartphones. The company also often uses it for its own data collection. “Our products and capabilities are unique in several ways—because of our access to places around the world at the street or neighborhood level, where we have relationships with people who live in places that happen to be of interest to our customers. We travel extensively. We also have a large database of geographers around the world who we work with to help us provide credible, authoritative, and original answers to questions in a timely fashion.”
DATA
The kinds of data that Spatial Networks collects vary considerably, based on who is asking for what data, in what part of the world, and for what type of application, Quartararo explains. “A very generic, average use case would be the kind of data you find via Google when you do a search on a hotel in a city. We provide that kind of data in places where Google doesn’t and go above and beyond what Google does, almost to the extent of what Dunn & Bradstreet provide to businesses.” The company, he points out, does not mine and compile data from social media, such as Twitter, or other databases. “We are doing that from the ground, with local context, working with local knowledgeable people.”
TOOLS
Spatial Networks has been using a predecessor of Fulcrum for the better part of ten years to acquire data. “We didn’t like anything else on the market, so we invented our own product and have been build- ing on that,” says Quartararo. “About three years ago, we realized that there was a bigger market for Fulcrum if we made it into a commercial product that we could support and continue to develop and maintain and offer at a reasonable price across the world and do it in the cloud, so we embarked on that. We have people who use the application for their own personal travel, and for real estate, to rate office spaces. It is designed to work in data-starved or communications-denied areas, such as rural Afghanistan or East Africa, where WiFi and cellular are not very robust. You can collect data offline for weeks, if not months, and the next time you come in contact with a live WiFi hotspot or a cell service all of that data gets uploaded to your account in Fulcrum.” While Spatial Networks uses Fulcrum to collect data for its own projects, Quartararo assures that it does not access the data collected by any other users of the platform.
ANALYSIS
DigitalGlobe’s Human Landscape products, sold as stand-alone products as of this spring, consist of many files of geospatial data, typically in shapefile or KMZ format, which can be opened and analyzed in ArcGIS, Google Earth, or other similar programs. If an analyst at the company were tasked, for example, with predicting the locations of famine areas in North Korea or of future attacks in South Sudan, he would run the relevant data through DigitalGlobe’s special analytical tools and generate a predictive model, Dunmire explains. “The foundation that enables us to do that hard core predictive analytics is this human terrain data that we are producing. You can hunt around on the Internet and find pieces of this, but our analysts spend a lot of time compiling this data from multiple sources—well over 100 sources for most of these countries—and then, to the maximum extent possible, we use our imagery to confirm that data.” Some of the analysis is automated, “but we still use the human eyeball at some level to help verify the data.” DigitalGlobe recently analyzed election violence in Afghanistan for the U.S. government, by taking the human terrain base layer and then using analytical tools to do predictive analysis. Based on historical trends and the current environments, it identified the locations most susceptible to election violence. “We can model anything as long as we have the geospatial data for it,” says Dunmire. DigitalGlobe, whose staff includes several Ph.D.s, does most of its analysis in house, bringing in experts to help as needed. At times, after completing one of these human landscape projects, they send it out for review by academic subject matter experts. For Spatial Networks, analytical work is a relatively new program and is done all in-house. “When I talk about doing work in Brazil with people we know there, they are not doing the analysis,” Quartararo explains. “They are providing the raw data and then that data comes to us and we provide the analytical narrative or the ability to pull all that data together as a product for our customers.”
CUSTOMERS
DigitalGlobe sells its data products and analyses to companies, governments, and non-profits. “We rarely get the same request from different customers, so our products are all a bit custom-tailored,” says Dunmire. Some customers, such as George Clooney’s Satellite Sentinel Project, post the data they acquire from DigitalGlobe on their Web sites, while most commercial companies are targeting some commercial interest and don’t want to advertise broadly what they are doing. Either way, DigitalGlobe uses only open source information, so that their customers are free to share it with other interested parties if they want to. “Our products’ metadata is extremely rich. We are very clear on where we got the information, what sources we used to verify it, and whether we verified it using our imagery.” They don’t, however, use social media feeds.
PRIORITIES AND BUSINESS MODEL
Current or anticipated customer requirements are generally what drive DigitalGlobe’s priorities in deciding which country data set to produce next and which to update. “Africa is probably the continent that we are going to try to complete first,” say Dunmire. “There are 53 countries in Africa and we have done well over half of them—mainly in Northern Africa, because that is where there has been a lot of interest. There is huge benefit in having the whole continent done because some of the trouble bleeds over from one country to another and some of the human terrain issues move from country to country and the boundaries often follow ethnic lines rather than national borders.” “Our business model is to gather raw data wherever we can, based on what we understand is a requirement by a customer or a segment of the market for derivative products,” Quartararo explains. “Then there are analytical products that are a combination of both the derivative data products themselves as well as providing subject matter expertise from an analyst standpoint that helps the customer understand the data and how it can be used. Then, of course, there is our technology component, which offers products like Fulcrum and a number of other ones.” One, called Pushpin, is a mobile application derived from Fulcrum that is designed to allow people around the world to contribute to the OpenStreetMap community. Spatial Networks made it available for free. Another derivative of Fulcrum, GraffitiMapper, enables users to measure graffiti as an indication of social well being—good, bad, or indifferent.
CONCLUSIONS
DigitalGlobe and Spatial Networks are only two of the many companies that are now offering data and analysis on human geography. Market demand and capabilities for data collection and analysis are sure to grow in the near future—paralleling the growth in the demand for and the supply of ever more accurate and comprehensive data on our planet’s physical geography.
North Korea Human Geography Case Study
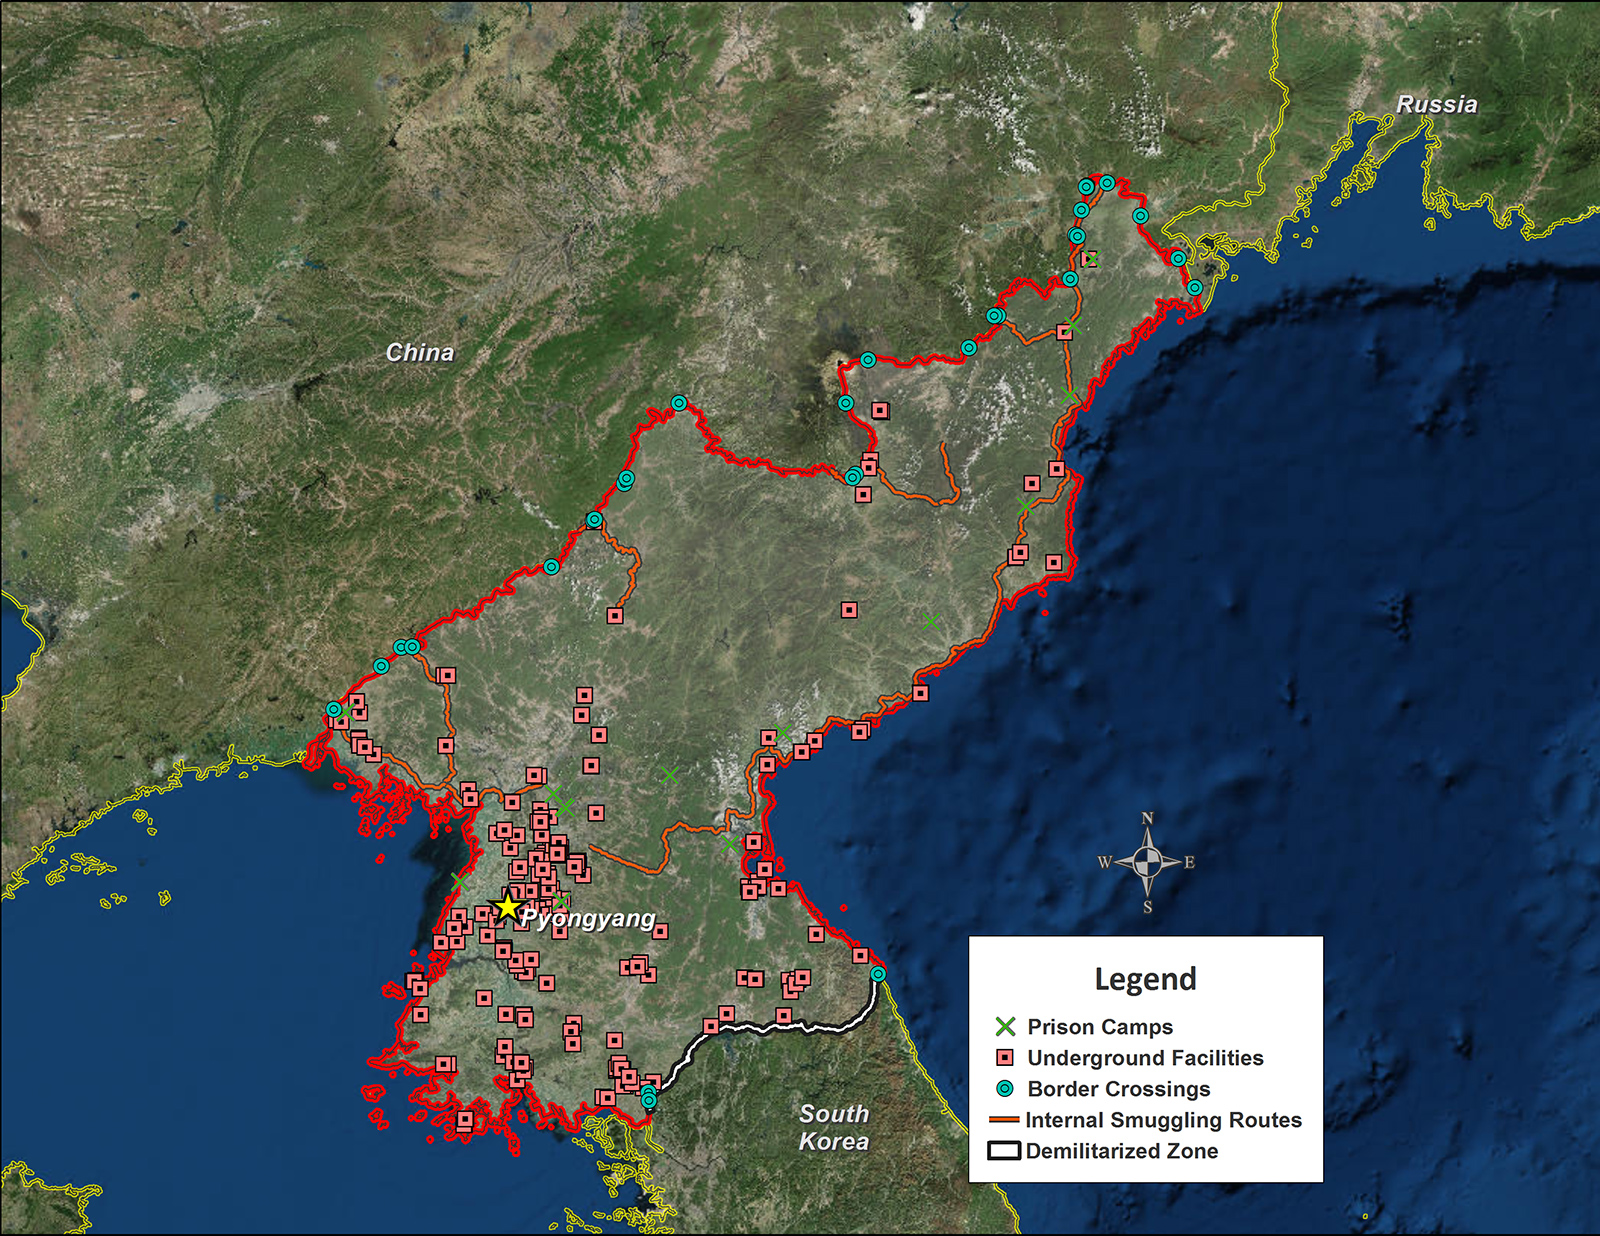
FIGURE 1.
North Korea showing prison camps, locations of underground facilities, internal smuggling routes, and the demilitarized zone (DMZ) on the southern border with South Korea
Since Kim Jong-un assumed power in North Korea after his father’s death in 2011, he has overseen an increasingly unpredictable military state that is shoring up power domestically and causing worry among the military state’s regional neighbors. In 2013, Kim threatened a pre-emptive nuclear attack on the United States and released a video showing nuclear war breaking out across the United States. That same year, North Korea tested short-range missiles that could cross the Sea of Japan, causing the U.S. to deploy additional Aegis missile cruisers to the region to fulfill its defense commitment to Japan. Indeed, preserving relative peace and stability on the Korean peninsula is one of the drivers of America’s recent pivot to Asia. As North Korea assumes a more threatening posture on the international stage, there are still important questions left unanswered. Yet with so much of the world’s attention focused on this hermetic and polarizing state, our knowledge about the country is limited. Our satellites provide insights in the general geography, but government and non-governmental bodies alike are constantly searching for more and better geospatial data to understand not just the physical realities of the nation, but also its human geography. We have known for some time that North Korea illegally detains tens of thousands of its own citizens in political prisons hidden from outsiders. Although North Korea’s government denies such facilities exist, a recent report by Amnesty International found that these camps are expanding to hold even more political prisoners. Murder, rape and forced labor for military production purposes are common in these camps. DigitalGlobe’s satellite imagery and geospatial data has played a crucial role in revealing the location, nature and potential future sites of North Korea’s prison camps (gulags).
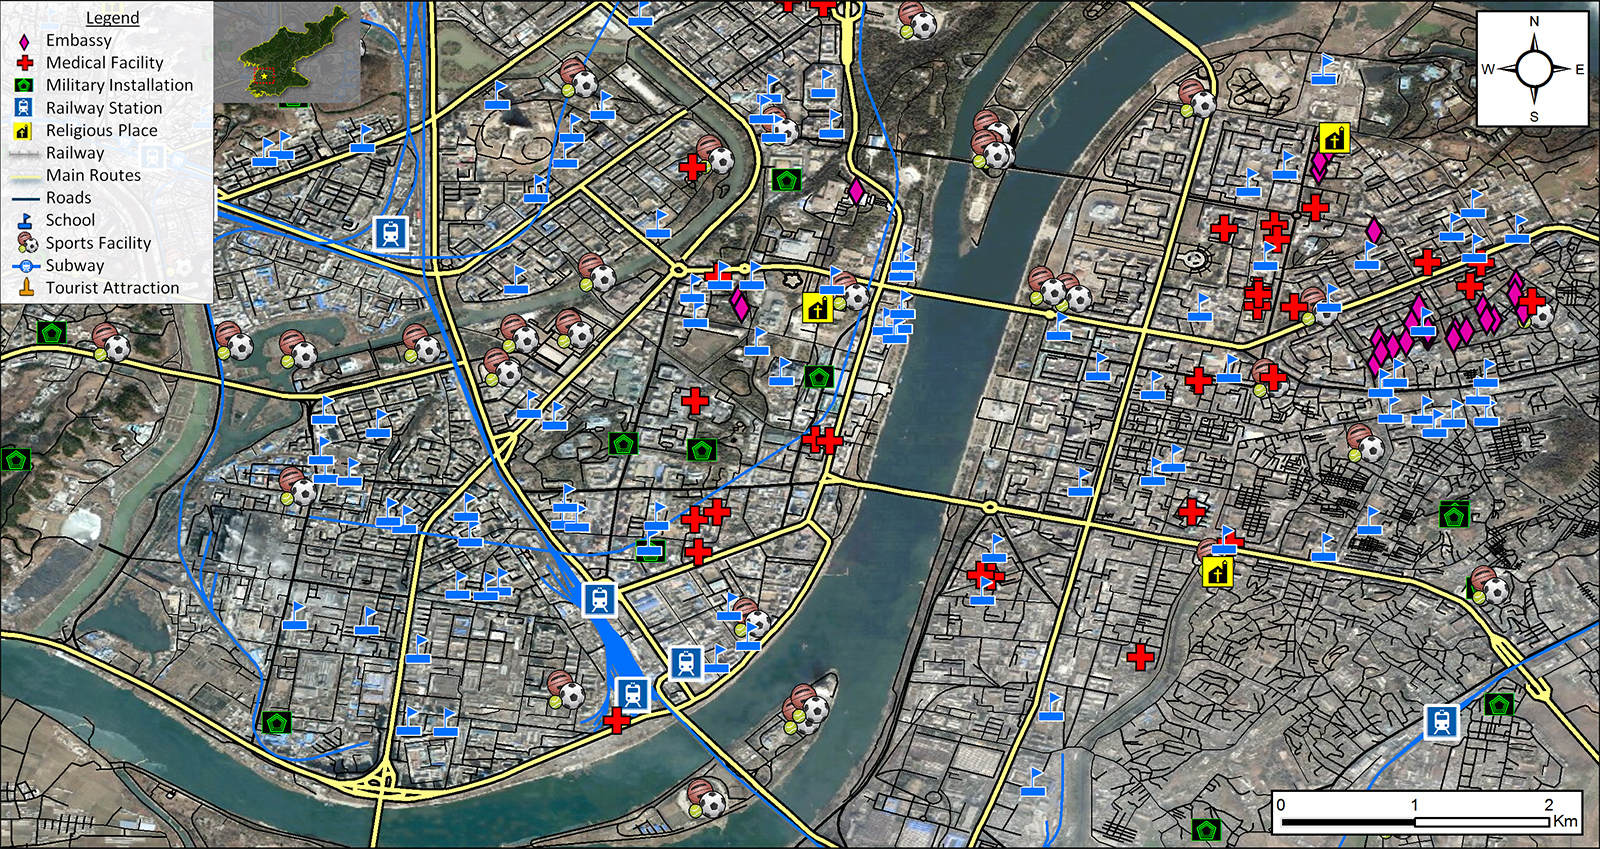
FIGURE 2.
Pyongyang, North Korea, showing embassies, medical facilities, military installations, and other areas where people move from place to place
Similarly, North Korea’s secret underground facilities have long been the nerve center of the nation’s military-industrial complex. The hundreds of Underground Facilities (UGFs) have been used to develop and test nuclear weapons, create munitions, store military hardware and pursue other activities the Kim regime would like to hide from Western eyes. Although we know what many are used for, the activities and locations of some are still unknown. Given the military nature of all of North Korea’s known Underground Facilities, it’s vital that we know the answers to questions such as: Where are current UGF sites located? Where might North Korea build future UGFs? What are the location-based factors most closely tied to the presence of UGFs? Identifying areas where future UGFs will be located allows leaders and planners to focus their limited data collection assets and resources. To identify areas where future sites are most likely to be located, DigitalGlobe identified more than 16,000 geospatial points of interest in North Korea based entirely on open source data, using more than 130 data sources, creating more than 60 data layers that included religious institutions, roads, schools, hospitals, transportation hubs, manufacturing facilities, and more.

FIGURE 3.
Punggye-ri Nuclear Test Site, North Korea, April 11, 2014
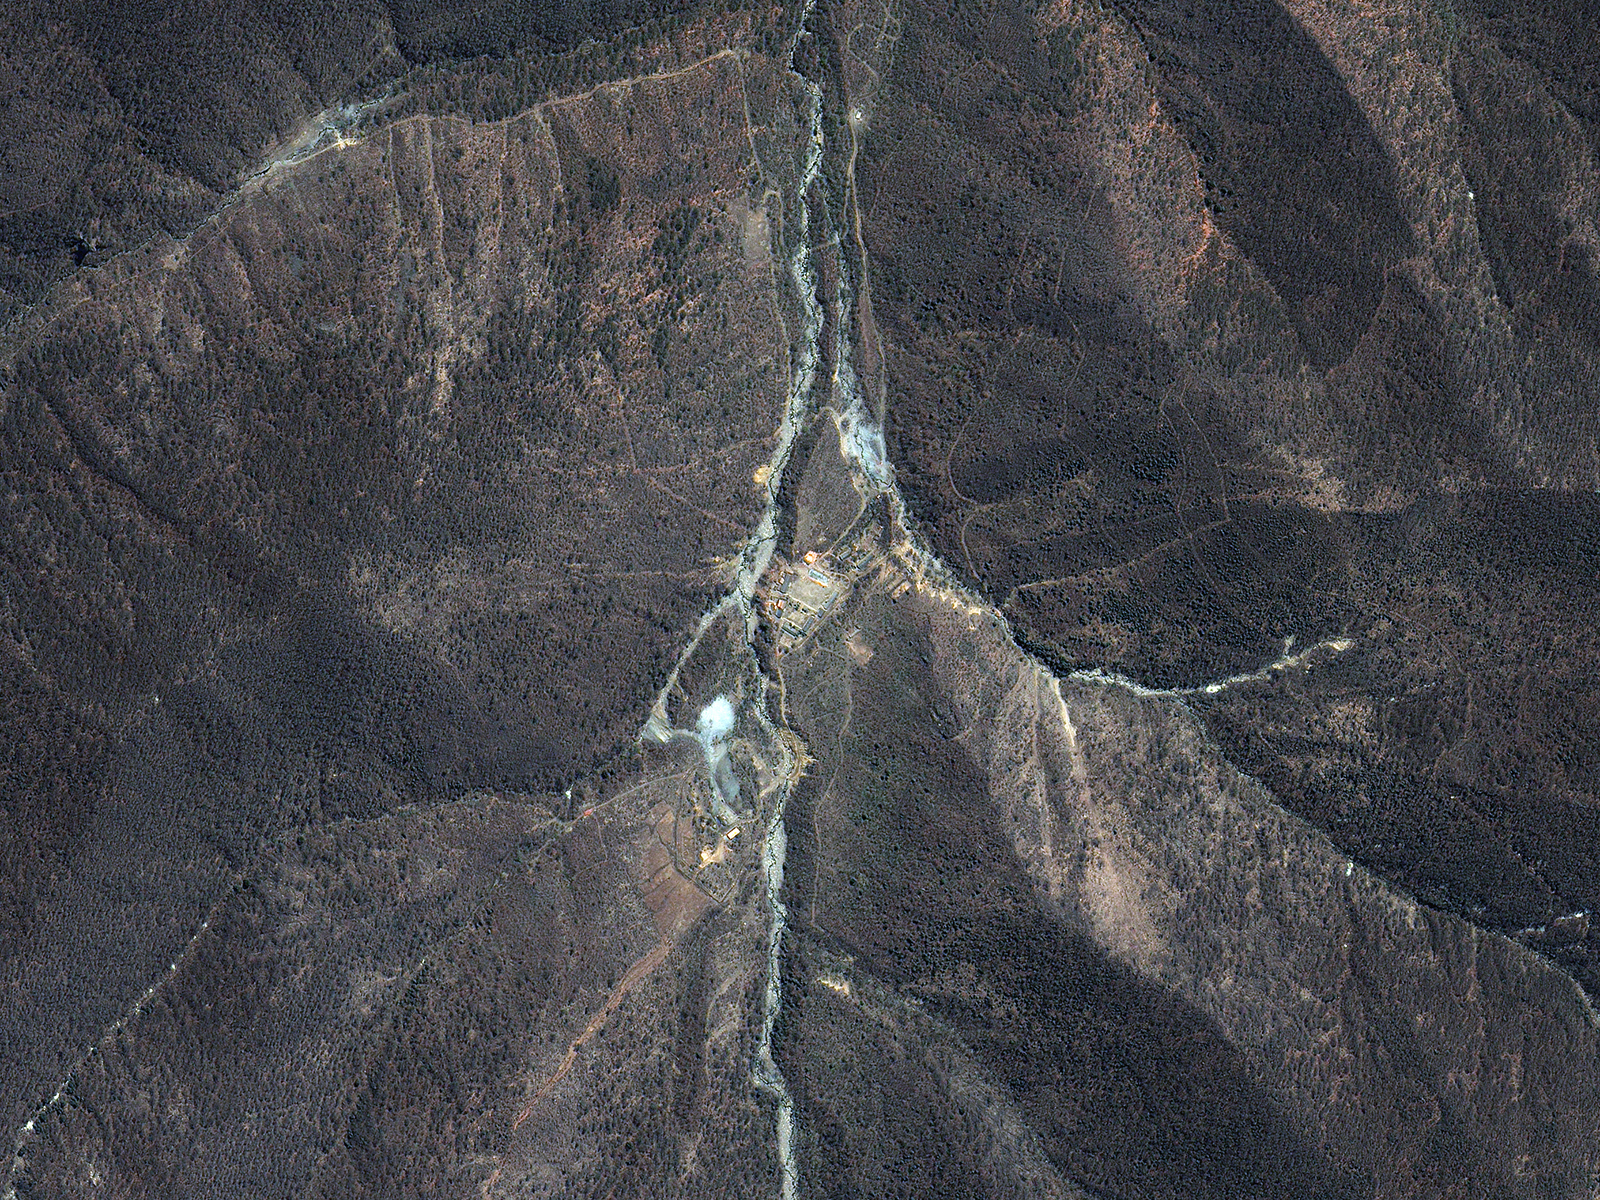
FIGURE 4.
Showing the same site, May 9, 2014
The location of each point of interest was then correlated with known UGFs. Knowing where each one was located relative to the points of interest allowed DigitalGlobe to significantly narrow the area of locations where North Korea is most likely to either build or already have secret UGFs. This information gives NGOs and governments a significant tool in their ability to fully understand North Korea’s military capabilities, potentially allowing them to monitor activity around them. Increased activity at one of these facilities could reveal clues about North Korea’s state of military readiness—for instance, potentially allowing allied governments to prepare for a coming attack. Given North Korea’s recent aggression and unpredictability, this information is vital to fully understanding the military threat and formulating an appropriate response. It is also just one example of how human geography data helps provide insight into the world.