Fresh water is humanity’s single most critical resource. According to a recent United Nations report, stresses on water supplies aggravated by climate change are likely to cause more conflicts, and water should be considered as vital to national security as defense. The report points out that 145 countries share watersheds with neighbors and there are more than 300 transboundary aquifers from which groundwater can be extracted.
Yet, we still do not fully understand how much water is available and how it is distributed, which is a requirement for planning how to deal with changes in climate and, particularly, in rainfall. This knowledge gap is due to limitations in the relevant science and technology, the vastly insufficient number of sensors deployed around the world, especially in developing countries, and data denial by many governments due to security concerns.
Satellites, however, are dramatically changing this picture, by enabling us to measure the total mass of water on Earth and its various components, as well as to monitor how these amounts change over time. They are providing “the sole body of information that we wouldn’t otherwise have,” says Dr. Jay Famiglietti, Professor of Earth System Science and of Civil and Environmental Engineering at the University of California at Irvine and Director of the university’s Center for Hydrologic Modeling, who has been studying the subject for more than 30 years. Globally, new knowledge about water from satellites gives us insights into current conflict and future international security issues. Locally, it greatly improves the science and the practice of water resource management.
Water-Related Satellite Missions
The vast majority of water on Earth is surface water—in oceans, seas, and lakes. The rest is distributed between atmospheric moisture, soil moisture, deep underground aquifers, snow, ice sheets, and sea ice. NASA satellite missions employ different sensors and techniques to measure each of these water reserves. They include:
GRACE (Gravity Recovery and Climate Experiment), launched in 2002, which maps gravity to detect the changes in total mass of water in large regions, and GRACE-FO (GRACE Follow On), scheduled for launch in 2017; they are both joint U.S.-German projects. See FIGURE 1.SWOT (Surface Water and Ocean Topography), scheduled for launch in 2020, will map surface water by measuring its height using radar; it is a collaboration between NASA, CNES (Centre National d’Etudes Spatiales, the French Space Agency), and CSA (the Canadian Space Agency). AirSWOT will calibrate and validate the radar for the SWOT mission, by deploying it aboard aircraft.
Other water-related NASA missions are TRMM (Tropical Rainfall Measuring Mission), launched in 1997, to be followed by GPM (Global Precipitation Measure- ment), scheduled for launch in 2014; ICESat-2 (Ice, Cloud, and Elevation Satellite-2), for ice sheets and sea ice, scheduled for launch in 2016; GLISTIN-A (Airborne Glacier/Land Ice Surface Topography Interferometer), flown in 2009 and proposed as a spaceborne mission; and AirMOSS (Airborne Microwave Observatory of Subcanopy and Subsurface), which began in 2012. Scheduled for launch in 2014, SMAP (Soil Moisture Active Passive) will use a radiometer and a synthetic aperture radar (SAR) to provide global measurements of soil moisture and its freeze/thaw state. Another NASA sensor, MODIS (Moderate Resolution Imaging Spectroradiometer), which is a key instrument aboard the Terra and Aqua satellites, has been effective at collecting data on snow and there are plans for a Snow Water Equivalent- specific sensor. However, this article focuses only on surface and ground water.

FIGURE 1.
The GRACE satellites before launch. Courtesy of Astrium.
Grace
The GRACE mission consists of two satellites, operating together as an instrument to map Earth’s gravity and, therefore, its mass. They are in the same orbit at an elevation of about 500 km and at a distance of 220 km from each other. When the lead satellite flies over an area with above-average mass, such as a mountain range or a large amount of underground water, it dips lower, due to the additional gravitational attraction exerted by that mass; conversely, when it flies over an area with below-average mass, such as an ocean trench, it will rise a little higher. Its twin, following behind in the exact same orbit, will do the same. Therefore, by continuously measuring very precisely the distance between the two satellites, scientists are able to map the distribution of the Earth’s mass.
In turn, this allows them to map water, because most of the big motions of mass are in the water cycle, explains Dr. Michael Watkins, manager of the Science Division at NASA’s Jet Propulsion Laboratory (JPL) and Project Scientist for the GRACE and GRACE Follow- On missions. “For example, ocean tides, big flooding events, or tropical
monsoons—that’s a lot of mass! It can be up to billions of tons of water mass, actually— and those events, averaged over some time, are enough to actually move the satellites in their orbits.”
Because of both what it does (using changes in gravity to map the Earth) and how it does it (using satellites not just as platforms for instruments but as the instruments themselves), GRACE is a first-of-a- kind mission. “It’s not often that you see a new remote sensing technique introduced from space like this,” says Watkins. See FIGURES 2-3.
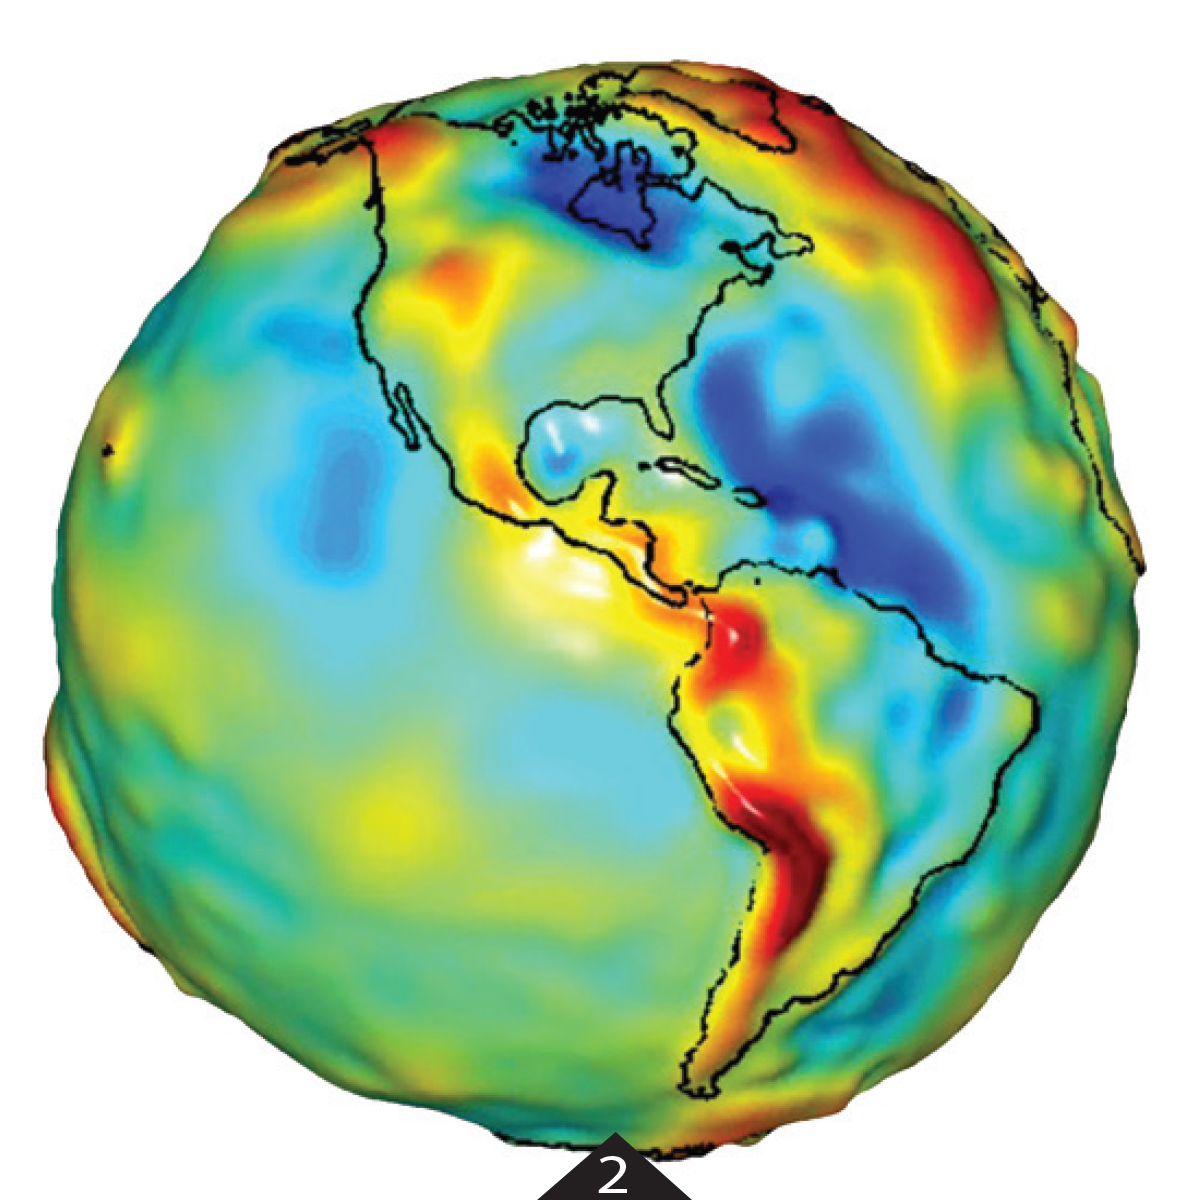
FIGURE 2.
GRACE gravity model of The Americas.
Image courtesy of University of Texas Center
for Space Research and NASA.

FIGURE 3.
Before the launch of NASA’s GRACE satellite in 2002, knowledge of gravity was based upon decades of data from geodetic satellites (left image). Monthly gravity
measurements are possible now that are 100x more accurate than previous models. The map on the right was produced after only 13 months of GRACE data.
Jointly funded by the U.S. and German governments, GRACE was designed for a five year mission, but it just passed its 11th year. “It actually is aging,” says Watkins. “It does not operate throughout the whole year now, because of some battery degradation. So, we are concerned that it will stop collecting data in the next couple of years.”
Using a microwave link, GRACE measures the change of distance between the satellites at micrometer resolution. “The mission scientists need to know the change in the distance between the centers of mass of the two satellites,” explains Albert Zaglauer, Project Manager at Astrium GmbH, the German company that built the satellites. “However, the measurement principle only allows you to measure the distance between the phase centers of the two antennas. So, you have a very accurate measurement of a distance of 220 km with a micrometer resolution between the phase centers of the antennas, but on each satellite, between the phase center of the antenna and the center of mass of the satellite, there’s another 1.5 m and no one knows exactly how this distance is changing.” Therefore, in order to preserve the measurement accuracy, Astrium used a combination of high-tech carbon fiber and ceramic material to build a system that is mechanically extremely stable.
Another mission-critical challenge was to de-correlate the effects on the satellites of gravity changes from those of surface forces, such as atmospheric drag or the pressure from the Sun’s radiation, which can mimic changes of the Earth’s gravity field. This was accomplished by deploying aboard each satellite an extremely precise accelerometer, called SuperSTAR, with a resolution of 0.1 nano g and better, explains Dr. Pierre Touboul, Director of the Physics Branch at ONERA (Office National d’Etudes et Recherches Aérospatiales), the French national aerospace research center, which built the devices. Like the satellites themselves, the accelerometers were also built for a five year mission but are still operating well, he says.
To improve the resolution, on future GRACE missions, NASA will replace microwave ranging with a laser system, enabling a better interferometer, Watkins explains, because laser wave lengths are about 1 micrometer, or 10,000 times smaller than those of microwave radiation. “So, instead of measuring the distance between the two spacecraft to micrometers, we will measure it to nanometers, almost atomic distances.”
“Understanding the storage changes all over the Earth has been really, really critical,” says Famiglietti. “Previously, we’ve been able to measure inflows and outflows but not the storage changes. So, we have a huge amount of uncertainty and eror that accumulates. With GRACE we have an opportunity to measure those storage changes. Having this synoptic picture from satellites and finally being able to put it together is going to provide us with a whole bunch of new information. It opens up a lot of very interesting science in climate, hydrology, eco-hydrology, and the science of water resources management.”
“GRACE can be seen as a climate research mission,” Watkins points out. “It helps us understand why Green- land ice is melting or why we have large-scale precipitation and water cycle changes. In addition, because you get this unique measurement of ground water, there are applications for water security and water management.” See FIGURES 4-5.

FIGURE 4.
The Middle East had major losses in water storage, shown here in millimeters from Jan. 2003-Dec. 2009. Red shows drier condi- tions, with blue showing wetter conditions. The majority of the water loss was due to reduc- tions in ground water due to human activities. Image credit: NASA/UC Irvine/ NCAR.
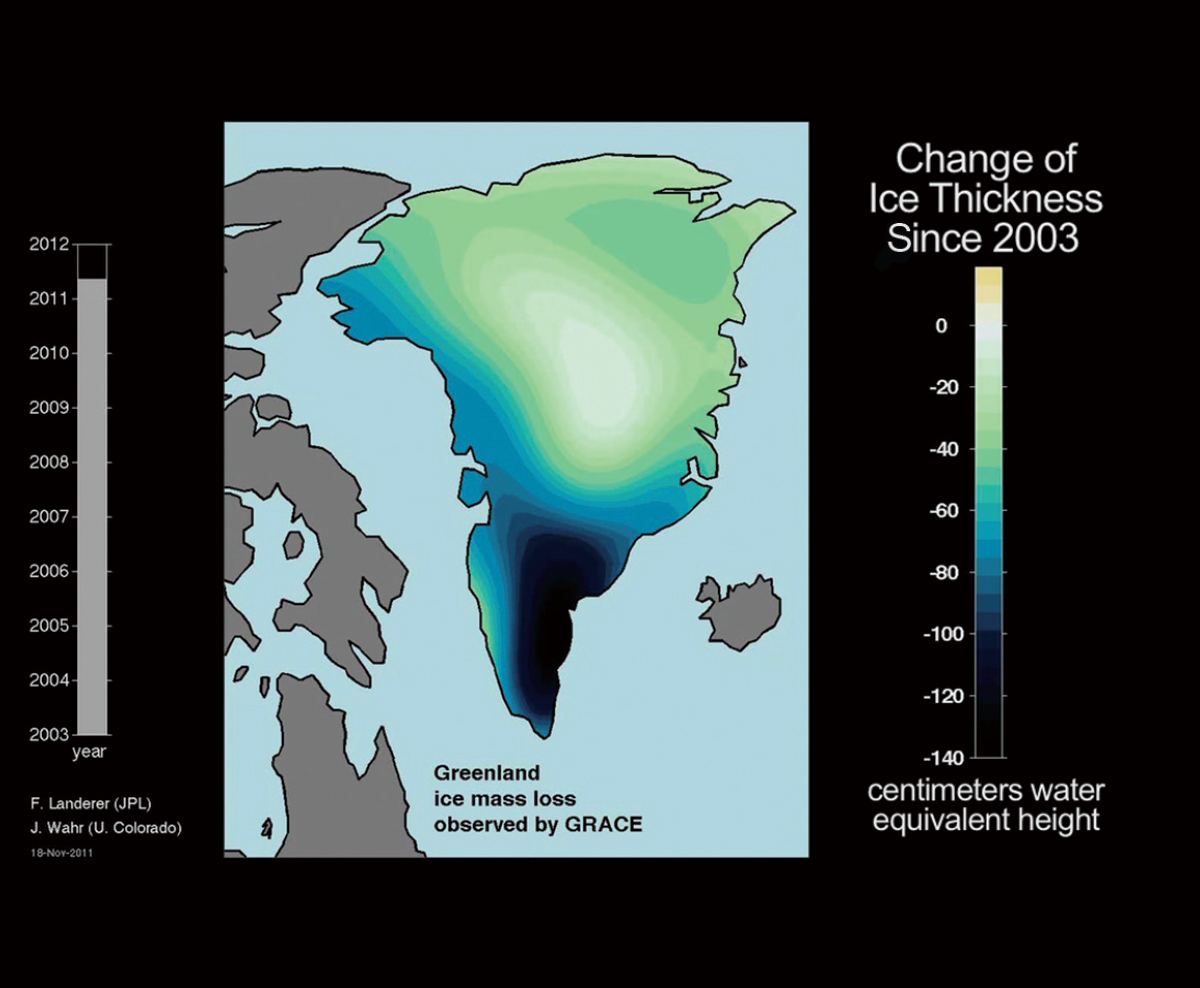
FIGURE 5.
GRACE measures changing ice mass of Greenland, which has had major reductions, shown here. Image credit: NASA/JPL-Caltech/ University of Texas Center for Space Research.
SWOT and AirSWOT
The SWOT mission brings together U.S., French, and Canadian members of two scientific communities: hydrologists, who study terrestrial surface waters, and oceanographers, who study the world’s oceans. It will make the first global survey of Earth’s surface water, observe the fine details of the ocean’s surface topography, and measure how water bodies change over time. It will also benefit studies of ice sheets and of sea ice, because by measuring how much sea ice is sticking above the water, scientists can infer how much of it is below the water. JPL will analyze the data collected by the SWOT satellite.
The SWOT mission will be the first one to map in detail where surface fresh water is, where it is going, where wetlands, lakes and reservoirs are, and how the distribution of water is changing—a subject about which we have “very poor knowledge,” says Dr. Delwyn K. Moller, Senior Engineer at Remote Sensing Solutions, Inc., Principal Investigator for the AirSWOT radar payload, and a member of the SWOT Science Definition Team. “We have no picture of global surface water inundation, how it changes over time, how water moves up and down, how it spreads out laterally over the surface,” says Famiglietti. “We hope to be able to understand how the heat of the ocean is transported, both vertically and horizontally, and that affects how climate change will affect the Earth,” says Dr. Ernesto Rodriguez, Principal Investigator for AirSWOT and Payload Scientist for the SWOT mission at NASA JPL.
SWOT will deploy a Ka-band synthetic aperture interferometric radar, which is a new technology, operating at a wavelength of approximately 8 millimeters and a center frequency of 35.75 GHz. The technology in those frequencies has developed rapidly and has made it feasible to build a boom structure only 10 meters wide, Moller points out, making it possible to have a single-satellite solution. (By comparison, the boom on the Space Shuttle for the Shuttle Radar Topography Mission, or SRTM, was 60 meters wide.)
The satellite, which will have two antennas, will transmit out of one and receive on both, explains Dr. James R. Carswell, president of Remote Sensing Solutions, Inc. “By doing so, they can basically use triangulation in the simplest form, measuring very accurately the phase of these very high frequencies so the return can estimate the angle of arrival and then, therefore, measure the topography.” See FIGURE 6.
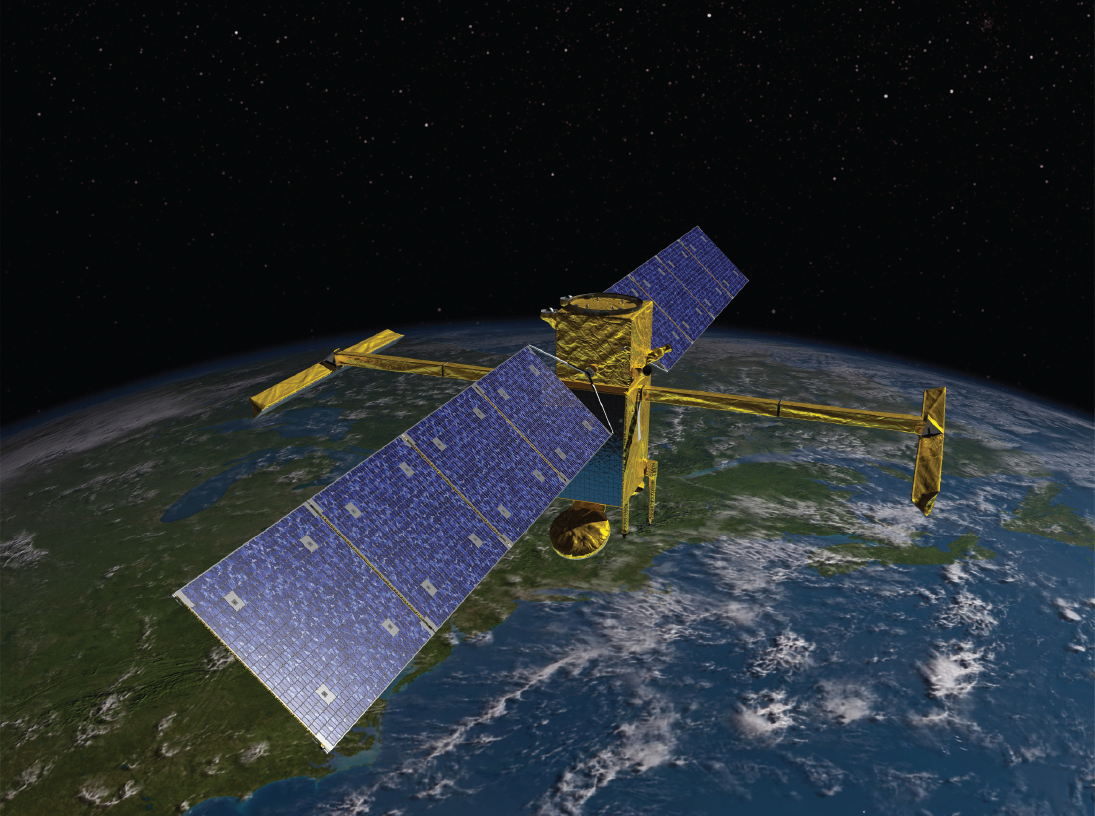
FIGURE 6.
Artist’s concept of NASA’s SWOT satellite, planned for launch in 2020. SWOT is designed to make the first-ever global survey of Earth’s surface water—lakes, rivers and ocean—collecting detailed measurements of how water bodies on Earth change over time. Courtesy of NASA/JPL-Caltech.
The SWOT radar, called KaSPAR (Ka-band SWOT Phenomenology Airborne Radar), which is now flying as part of the AirSWOT program, actually consists of six Ka-band SARs all packaged together, says Carswell.
“It will obtain measurements like SWOT from near- nadir out to about 8 degrees, being able to map surface water height to 2 centimeter uncertainty. But then it has an extended swath that goes all the way out to 30 degrees incidence. This enables it to not only help vali- date the SWOT measurements but also to start seeing large features, such as eddies, that scientists using the SWOT measurements will be studying. It is going to be providing surface water topology with about 2 centi- meter uncertainty over that swath.”
“Previous missions are limited in their spatial coverage and resolution since they are profiling sensors. Because SWOT is an imaging mission, it will allow us to resolve the mess and submeso-scale circulation features at scales down to 10 km. We are trying to get down to centi- meter level, on a 10 km scale. Over the land, the spatial resolution will be greater (50 m), with a relative water height accuracy of 10 cm. Currently, hydrologists have no data even close to this level of resolution; therefore, SWOT will be a transformative mission.”
Ground-Based Sensors
To get the full picture about water, scientists also need the best available data on the ground—from stream and rain gauges, soil moisture stations, snow monitors, sensors in ground water wells, and so on. In addition to helping to validate the satellite data, this in situ data “is more reliable and more continuous and is at a high enough resolution and density in space and time that it can really help us manage water where people live,” says Famiglietti. “In science, most of us are driving toward trying to combine all of this stuff into detailed models that will integrate the ground- based data and the satellite data and put together a complete picture of how water is distributed, laterally and vertically. We can’t do that without ground-based measurements. The best places to put sensors are where the change is most rapid or where the most people live.”
Combining Sources and Techniques
The challenge for scientists is to figure out how useful each of these different technologies is and to combine the data as effectively as possible.
Depending on the sensor, the resolution can vary from meters to hundreds of thousands of square km.
GRACE has a spatial resolution of 150,000 sq km or greater and a time resolution of months or longer. “So, it’s not going to tell anybody how wet the soil is in the center of the University of California at Irvine campus tomorrow,” Famiglietti points out. “But it is going to tell us overall storage changes in Southern California for the month of March. Other sensors—like SWOT, for example—will be measuring at much higher resolution and will actually be able to see within a major reach of a channel what the flood plain inundation looks like and how it changes during the course of a seasonal storm that might last for a few days. Ultimately, the combi- nation of something like SWOT with GRACE and SMAP will really provide just an incredible amount of new information.” Once you subtract the data from SWOT and SMAP from the total amount determined by GRACE, the rest has to be below the root zone, he explains. “That’s huge, actually.”
“The water storage over a large area has to add up and be constrained to what GRACE is observing,” says Watkins. “The combination of highly local and very precise data with the very precise GRACE large- scale data makes a unified product. So, the cutting edge people are putting all of this data together in a big model constrained by GRACE.”
Conclusions
Satellites provide a global picture that doesn’t know any political boundaries. “We’re able to really see what’s going on,” says Famiglietti. “In particular, with water, we can understand what all the stress points are—whether they point to heightened conflict in the future or to opportunities for collaboration. As the technology improves and hydrologists figure out how to use it better and construct better and better pictures of where the water is, the data denial policies of many countries will become obsolete. It’s going to be in everyone’s best interest to contribute data and use it to their advantage. Ultimately, we’ll see—maybe in the developing world or in conflict-prone regions—a lot of people may use water as a means to collaborate, rather than to fight.”
The water-related missions undertaken by NASA and its partner agencies are rapidly expanding our knowledge of water at a time when the twin challenges of climate change and population growth are making this knowledge a key to reducing conflict worldwide.