

BY PERRY PETERSON / PRESIDENT/CEO CALGARY, ALBERTA, CANADA / WWW.PYXISGLOBE.COM PYXIS, MEMBER OF OPEN GEOSPATIAL CONSORTIUM
HUMANITY’S ABILITY TO MEASURE, MONITOR, AND COMMUNICATE over the vastness of the entire Earth is unprecedented. Satellites swarm the Earth observing and measuring the events below. A web of sensors monitors and controls changes and movement of a billion things each second. Silos of important content that describe places and their features grow and grow within millions of organizations. Trends point to ever-growing volumes of rich data describing the planet. People, from scientists to citizens, expect this information in a form that can answer their pressing questions…instantly. At the same time, we are experiencing the rapid unprecedented consequences of environmental changes. It is hoped that the data and information describing these changes can be transformed into the knowledge and decisions that will mitigate the cost. However, promised societal benefits and the commercialized value are difficult to realize.
Nowhere are these changes more evident than in the Arctic. The singularity of a pole in a region of vying national interests, traditional peoples, climate change, resource extraction, emerging shipping routes, and a suffering ecosystem have given the Arctic new attention. However, access to Arctic geospatial data has long been a challenge. Remoteness and equatorial fixated map projections have made it difficult to include polar data in the normal offerings of scientific and consumer mapping products.
The Open Geospatial Consortium (OGC) will release a candidate for a new Earth reference standard that promises to solve these challenges. It is formally called a Discrete Global Grid System (DGGS). Although DGGS may be new to some, its formal development began in the 1980s with the promising value of global analysis coinciding with the increased use of geographic information systems (GIS) and availability of global data and positioning systems. OGC defines a DGGS as “a spatial reference system that uses a hierarchical tessellation of cells to partition and address the globe. DGGS are characterized by the properties of their cell structure, geo-encoding, quantization strategy and associated mathematical functions.”
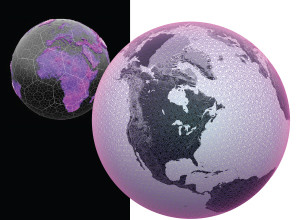
Δ FIGURE 1. ISEA Hexagonal Discrete Global Grid System
The difference between conventional geographic coordinate systems and a discrete global grid system is analogous to any “digital” discrete information system. Using points of latitude and longitude to describe information on a continuous geographic surface is an analog model. It is like the continuous analog wave of sound produced by a vinyl record. However, to efficiently put that signal of music into a computer it has to become digital – broken into tiny discrete pieces with values assigned to each piece to reproduce the fidelity of the original sound.
A DGGS is a Digital Earth reference model. The DGGS uses equal area cells to partition and address the entire globe. Digital Earth is not continuous. Each tiny cell – they can be infinitesimally small – has a unique address. Spatial resolution is explicit as every item of information in a DGGS is associated with an area. Geospatial data values from any source, type, format, spatial reference, spatial scale, or frequency can be held in a DGGS cell. The hierarchy of cells provide rapid aggregation and decomposition of data values.
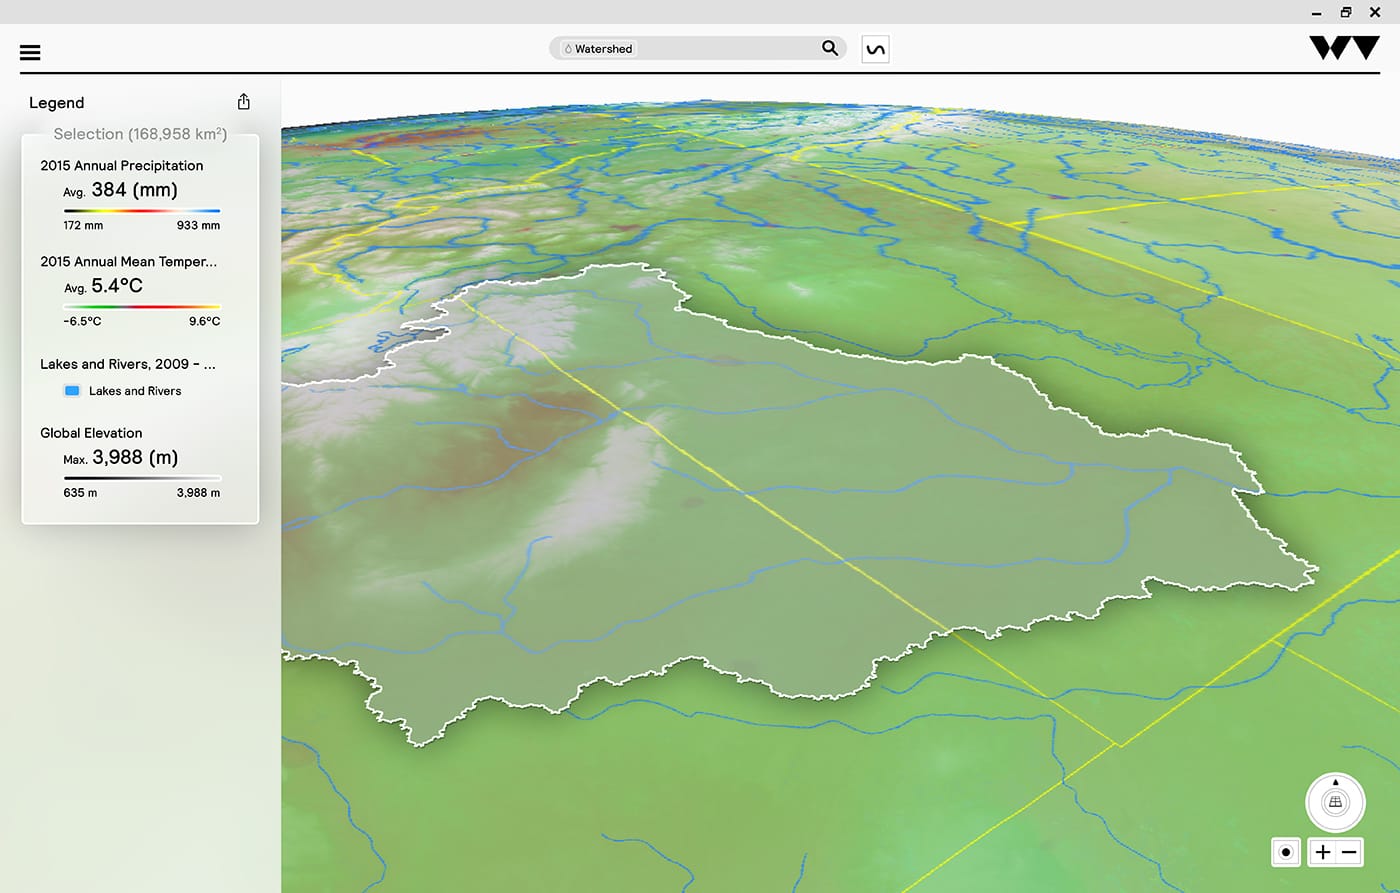
FIGURE 2.
The Yellowstone River Basin is shown here for watershed analysis, delineated and assessed using elevation, satellite, and other static and real-time data without the need for a GIS intermediary, in the WorldView Studio DGGS.
A DGGS is designed to be an information grid, not a navigation grid. Simply put, the DGGS is like a spreadsheet of tiny cells that cover the Earth. Information stored in each cell can record the condition and events describing that place. The idea of a standard means that everyone will use the same fixed cells to record everything from precise scientific observations to crowd- sourced events; a dynamic understanding of where one can find certain conditions and what is happening at the place of the user’s choosing becomes a simple task.
As a global spatial reference system, polar data in a DGGS is accurately portrayed and equally integrated with map information anywhere else in the world. The DGGS has many other features that exemplify the power of a Digital Earth as well. A DGGS allows multiple data sources to be integrated and analyzed in one workflow without the need to convert or change spatial reference systems. With the trend to more open on-demand systems, DGGS provides a user-centric approach where end users can search for and explore interesting phenomena from multiple content providers simultaneously.
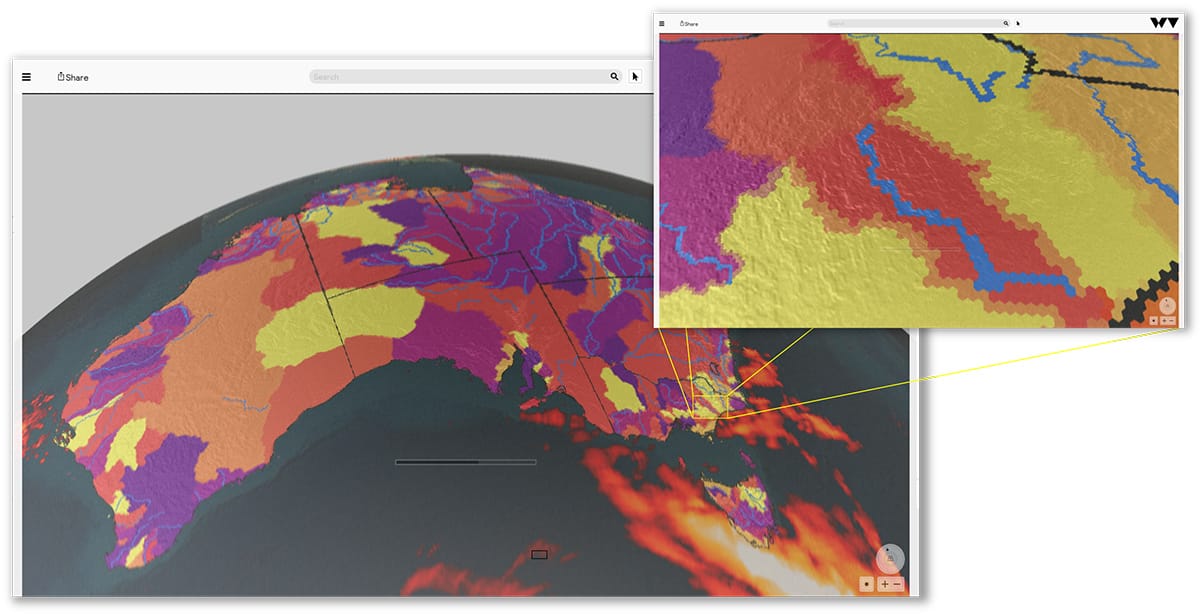
FIGURE 3. Tiny cells of the ISEA DGGS hold data from vector maps and raster imagery of Australia.
A simple question such as, “how many healthy trees are here now compared to 1986, 1996, and 2006?” is an expensive proposition, exemplifying the problem, the cost, and the bottleneck in the decision-making cycle. The primary challenge is pinning down what is meant by the term “here.” If one stands at the corner of the forest and asks how many trees are “here,” we might respond that there are no trees, for at the point under our feet there are none, or that there are the 40 we can see from where we stand, or it could be the entire inventory of trees within the ever-changing outline of the forest’s edges, or it could mean “here” is a reproducible connection of points defining the forest boundary in 1986. And this is the unfortunate bottleneck. What a human means by “here” can become an expensive, time consuming, and complex process of creating and maintaining a vector map for every feature or phenomena we want to understand.
With a DGGS, that changes completely. Data collected on trees can be recorded with whatever means is available. Estimates in 1986, a rough survey in 1996, a more precise map in 2006 and the almost daily count of trees from a satellite in 2016 can all be used to populate values in the DGGS cells. The decision makers in 2016 select what they mean by “here is the forest.” And the aggregation of cell values provides an instant best answer possible given the state of the raw data. Integration of content is on-demand and the once expensive operation is virtually free. This approach to maintaining the meaning of “here” permits easy repeatable manipulation, visualization and analysis of measurements from any location at any scale. “Big Earth Data” aligned to the digital cells of a DGGS is easy to access, store, sort, process, transmit, integrate, visualize, analyze and model. Producing insightful answers to pressing unanticipated questions, such as “what is here?” and “where is it?” are simple set theory operations.
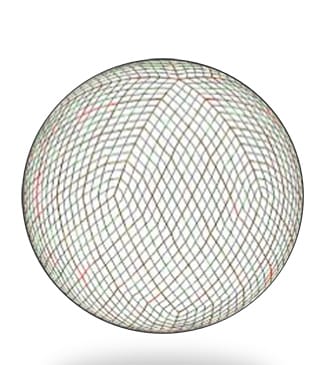
FIGURE 4. ISEA Triangular DGGS; cells are equal area, like pixels on a computer screen.
The world of DGGS assumes multiple sources of content that need to be assembled quickly. See the sidebars for real world examples.
The growth of the Web as a primary source of information dissemination has naturally led to the evaluation of different approaches to efficient Web-based mapping and spatial analysis. The requirement for very fast display of global maps on the Web led Google to adopt a simplified approach to digital mapping. In 2005, Google Maps was released using Web Mercator – a spherical variant of the Mercator projection suitable for partitioning and indexing map tiles for rapid transmission and display. Despite its controversial problems, Web Mercator has become the de facto standard for fast Webmaps.
3D virtual globes provide a spectacular visual navigation of pre-integrated imagery over the planet and represent Version 1.0 interface for a whole Earth information system. Al Gore, in his 1992 book “Earth in the Balance” and his 1998 speech on the topic, introduced Digital Earth. His idea was not merely of a 3D virtual globe to navigate and explore, but a vision for a participatory information system so simple and powerful that children could effectively understand complex facts and events that define the condition and history of our planet. The new OGC DGGS standard will provide the basis for adopting this new Digital Earth approach to geospatial decision making. A DGGS is fast, scientifically accurate everywhere on the planet, and allows distributed sources of information to be integrated by the decision maker on-demand. A recent survey of DGGS indicated that there are at least 10 DGGS in active development and use.
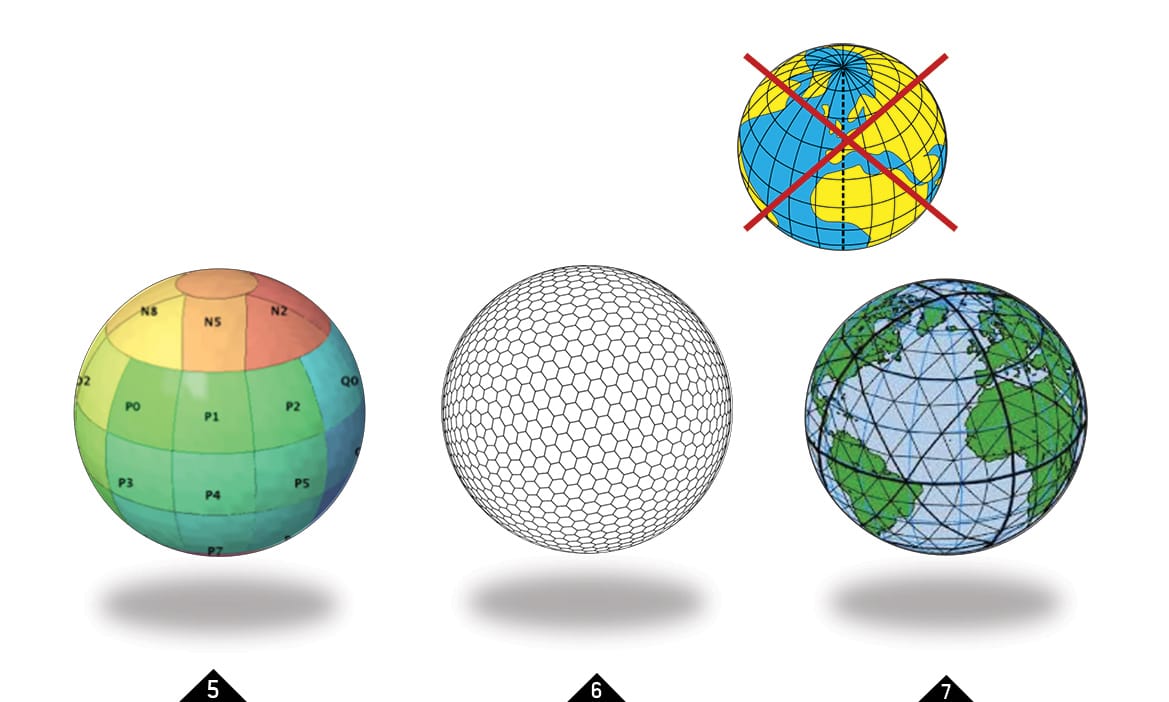
FIGURE 5. Rectilinear SCENZ-Grid
FIGURE 6. ISEA Hexagonal Grid
FIGURE 7. Quaternary Triangular Mesh (courtesy of Geoffrey Dutton)
SCENZ-Grid DGGS, developed by Landcare Research New Zealand, is a rectangular DGGS designed for use in high performance computing and cloud architectures for interdisciplinary environmental modeling. The Web Globe company PYXIS has developed DGGS technologies in collaboration with the Canadian and U.S. Governments. PYXIS Studio uses a hexagonal DGGS for Web-based content discovery, visualization, and analysis. Their rapid search, discovery, and fusion of geospatial content across multiple data juris-dictions has been successfully demonstrated in several OGC testbeds and Global Earth Observation System of Systems pilot projects.
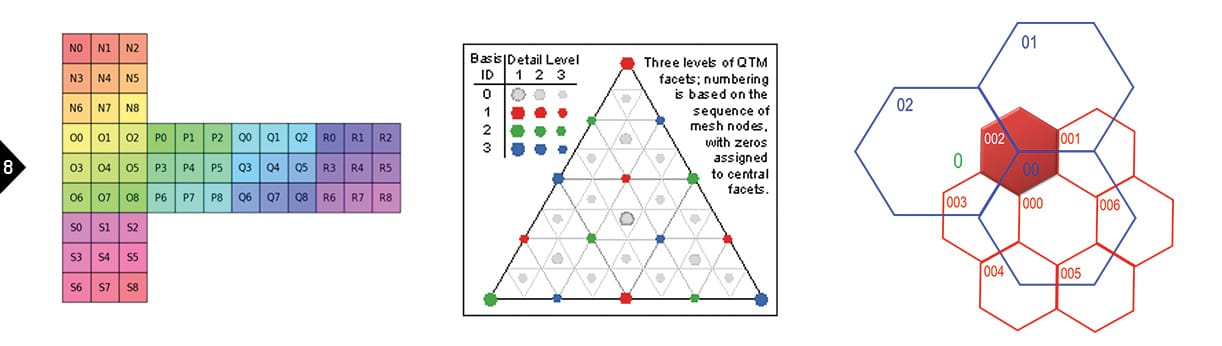
FIGURE 8. Like a cell in a spreadsheet that covers the Earth, each cell of a DGGS is given a unique address to facilitate efficient mathematical operations.
The Royal Canadian Geographic Society is distributing PYXIS WorldView to teachers where it is being used in classrooms to teach GeoLiteracy to children as young as 10 (https://vimeo.com/117639516). Users can also create and share their own globes – a feature that allows anyone to replace static Webmaps with embeddable smarter globes. You can access PYXIS Studio for free at www.pyxisglobe.com.
“The idea of a standard means that everyone will use the same fixed cells to record everything from precise scientific observations to crowdsourced events.”
Real World Example 1
If you are interested in profitably exploiting radiation from the sun, there are opportunities to use solar heating, solar photovoltaics, solar thermal electricity, solar architecture or artificial photo- synthesis, if you can understand the constraints. From remote sensing sources you will need historic measurements of solar radiation. From the regional authorities you will need cadastral property plans and the location of transportation and electrical transmission routes. You will need to know where the consumers of the power are located. You will want to avoid protected areas but access to land is vital. Property plans and land ownership, regulatory areas, existing developments, existing water courses and terrain are all important, too. All of these sources of information are geospatial; they represent something happening “here” – a place or places on a map.
Real World Example 2
A drought has hit a large area of the Amazonian rainforest. It’s the third drought in the last 10 years. NASA scientists want to determine its effect on the planet. The loss of trees means less carbon coming out of the air and the decaying vegetation means more carbon being replenished. The scientists must combine many years of data to define the meaning of a normal amount of rain over this area of the globe. Although there is a lot of data available in various forms, integrating all the data is a hard problem. Measurements must align with each other or the comparison is not useful. The overall health of the vegetation is determined in a similar comparison. Finally, the type of vegetation present in the forests is classified. Now the amount of carbon released into the atmosphere can be determined. With conventional methods, this actual study took several months to complete. With a DGGS, it takes about two days. The difference is the efficiency of data integration. When all these pieces of information are integrated together, the decision maker can ask, “Where is the drought severe? What was the result of the drought?”
Real World Example 3
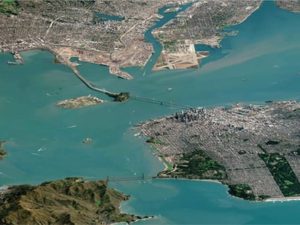
There is an unusual storm front forming over the mountains. A river flows through a city not far from the mountain streams that enter the river. What will happen here is a question people want answered, and fast! Satellite sensors and ground-based measurements provide clues of high rainfall intensity and duration, flow in the streams, land classification, wind, and soil conditions. Terrain models allow for the delineation of the catchment area and flood models. A historically large flash flood is expected within the next 12 hours. Warnings are sent to media with an outline of the potential flood areas. As the flood rises, land use maps are integrated with radar imagery to confirm the population affected by the flood. Twitter feeds begin to include requests for help. First responders implement their mobile command and control systems. Citizen responders want to help with machines and supplies. Many people are asking, “Where are the places where we can make a difference?”
As the ood waters recede, the damage appears formidable. With all the pieces of information
integrated together the decision maker can ask, “What has happened here?” Lives of people have changed forever. Supply chains disrupted. Local, regional and national governments respond along with private insurance companies to assess and categorize damages. Helping people with food and shelter is a priority. Rebuilding infrastructure may take billions of dollars. Learning lessons can assist policy making and future planning priorities.
All of these sources of information are geospatial. They represent something happening “here” – a place or places on a map.