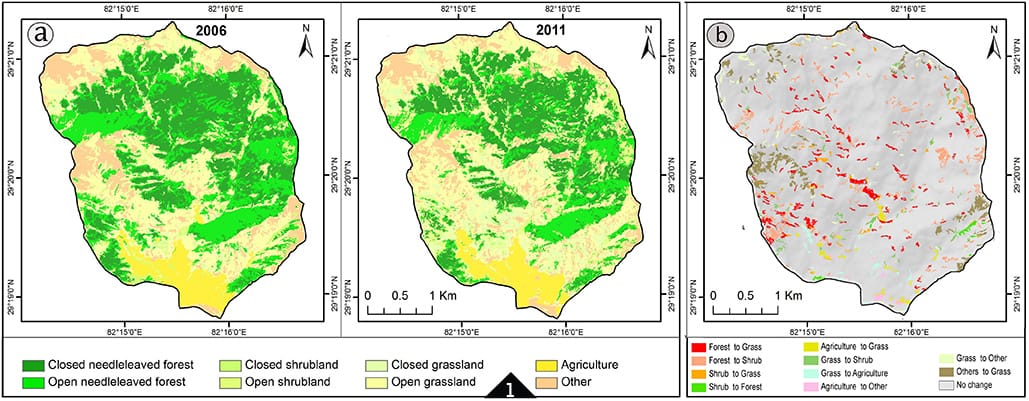
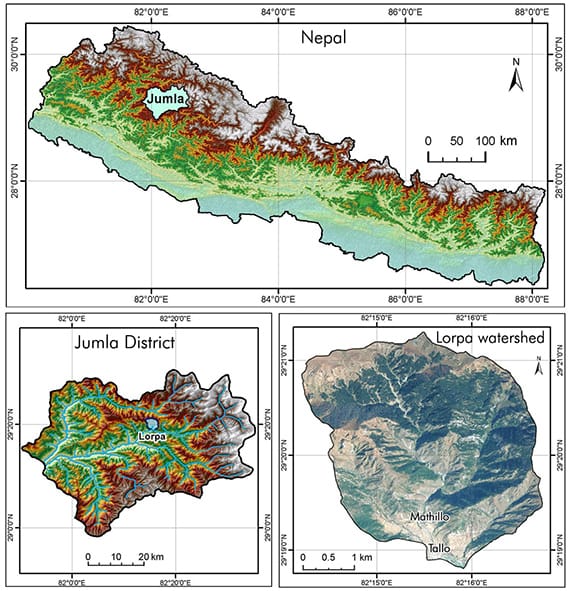
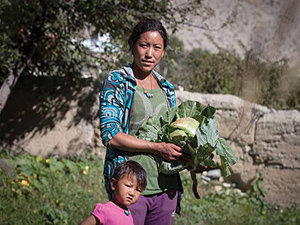
For decades, the high-mountain regions of Nepal have been caught in a perpetual catch-22. The small populations of these remote, isolated areas depend nearly exclusively on local natural resources for their livelihoods, yet they have to exploit those same resources in order to have roofs over their heads, heat their homes, cook their food and carve out livelihoods. In the remote mountainous region of Jumla, for example, around 90 percent of farmers subsist on agriculture production, but their landholdings are typically less than 2 hectares (5 acres) in size, making it difficult to produce enough food and provide enough area on which livestock can graze. So often, they allow their livestock to encroach on the vegetation and they collect firewood, herbs and other ecosystem goods to augment their income and food resources. It’s a land-to-mouth existence that has resulted in livestock overgrazing, overusing water and felling trees. Compounding the situation, major changes in climate have reduced water availability, increased temperatures and produced a shift in growing seasons – all of which impact agricultural production, and further drive people to draw from the environment for goods and services. FIGURE 1. Map of the Lorpa watershed showing land cover in 2006, 2011, and change detected. Based on eCognition’s analysis, the area lost 12% tree canopy. Although this catch-22 hasn’t gone unnoticed by the government of Nepal, the geographic isolation of Jumla and other remote areas have made it difficult for authorities to see just how inextricably linked agriculture practices and environment deterioration have become. And that’s presented authorities with their own dilemma: how do they develop initiatives to improve and sustain agribusiness as well as strengthen the resilience of the natural resource environment when they don’t have a clear picture of the environment itself? To resolve that challenge, the Ministry of Agriculture and Cooperatives (MoAC) has launched a number of studies focused on high-mountain regions to help gather the intelligence needed to plan smart strategies for economic development. One such study targeted the Jumla region, which aimed to help strengthen agribusiness in the region through more effective management of the local watershed. These maps of Jumla and the location of the Lorpa watershed are shown. However, with the geographic remoteness and isolation of Jumla, using traditional survey techniques to collect the local land cover detail needed would be costly and time intensive. So project managers used geospatial technology to bring the remote view of the vegetation to their desktops. Using a combination of satellite imagery and advanced land-classification technology, they not only produced two land-cover maps showing Jumla’s vegetation changes over time, they provided the visual truth to debunk some long-held, local beliefs that Jumla’s forests were not being lost to deforestation. A roughly 20-hour drive from Kathmandu, Jumla is a mountain district located in the midwestern region of Nepal. It is comprised of 30 small villages with a total population of just over 101,000 (as of 2011), the vast majority of whom depend on agriculture for their livelihood. Considered to be the birthplace of the Nepali language, Jumla is known for its biodiversity and spectacular scenery, as well as its lack of development; a 2012 National Population and Housing Census ranked it 68th out of 75 districts. And according to a United Nations Field Office report, 99 percent of households use firewood for cooking and up to one-third live below the national poverty line. Intent on improving Jumla’s plight, MoAC in 2010 launched the three-year High Mountain Agribusiness and Livelihood Improvement (HIMALI) project. HIMALI’s goals were to enhance the communities’ socio-ecological resilience to climate change and to help design effective local watershed management plans to ensure the sustainability of agribusiness in the region. The project specifically targeted two watersheds, one of which was the Lorpa watershed, as representative areas of the district. The responsibility of collecting the needed intelligence and identifying solutions fell to Kathmandu’s International Centre for Integrated Mountain Development (ICIMOD), a regional knowledge centre working to improve living standards and to sustain vital ecosystem services for the eight countries of the Hindu Kush Himalayas. In order for ICIMOD to identify and recommend solutions, it needed to better understand not only “Forests play an essential role in the health of mountain ecosystems so they are an essential element in devising development plans,” says Kabir Uddin, a GIS and Remote Sensing Analyst with ICIMOD. “We needed to inventory the forest cover down to the tree-crown level and map that over time – detail we couldn’t possibly gather with traditional surveys. The most cost-effective and accurate way to acquire this information was with satellite imagery and object-based image analysis (OBIA) software.” Having used Trimble’s eCognition® OBIA technology since 2006 for a number of land-cover mapping projects in Nepal, Bhutan, Bangladesh and Pakistan, Uddin and his team chose the image analysis and land classification software to create accurate land-classification maps for the Lorpa watershed, which comprises large areas of forest, a lower valley favored by agricultural activity, an intermediary zone and a high-mountain zone dominated by dramatic changes in vegetation. “Producing land-cover maps for mountainous areas can be challenging for traditional land-classification technologies because slopes, sun and satellite angles strongly affect spectral measurements,” says Uddin. “The advanced OBIA technology gives us the tools to overcome these unique challenges and map these regions with high accuracy.” The original plan was to map the watershed over a 10-year period; however, acquiring cloud-free or snow-free optical satellite imagery of the region proved most difficult. So Uddin’s team had to settle for a five-year interval instead. Uddin first defined the landscape characteristics of the 5-square-mile (13-square- kilometer) watershed area—typical tree cover, slope angles, proximities to urban areas—and then spent about two months compiling and preparing the core datasets. After pre-processing and validating the quality of the raster data, the data-processing team used Esri’s ArcGIS to calculate multiple indexes to help separate vegetation from non- vegetation areas – detail that would be integrated into the classification process. Then they began writing the customized rules to instruct the software to distinguish vegetation from other object types, and specifically to delineate trees down to the individual crown level. Uddin’s team built two eCognition rule sets to distinguish and map 10 land-cover classes including built-up areas, open grassland, agricultural land, open shrub, open needle-leaved forest (more than 40 percent tree canopy) and closed needle – leaved forest (less than 40 percent canopy). Specific to the forest-cover classes, the software also automatically delineated individual tree crowns into five size categories. Once the rule sets were complete, it only took the soft- ware 30 minutes to run the workflows and produce land cover maps for 2006 and 2011 showing the change in Lorpa’s vegetation between those two years. According to the maps, the Lorpa watershed went from a total of 47,121 tree crowns in 2006 to 41,689 in 2011, amounting to a reduction of 5,432 trees or a loss of 12 percent tree canopy. That equates to a loss of approximately 90 trees per month, the majority of which are those with the largest crown areas of 1,076 sq feet (100 sq m). The most significant reductions were in the southwestern part of the watershed where Lorpa’s two communities are located. To validate the accuracy of eCognition’s automatic tree crown detection, Uddin’s team chose ten 2.5-acre (1-hectare) sections at random on each pan-sharpened QuickBird and Ikonos image and manually digitized each visible crown in ArcGIS. They then com- pared their delineations with the software’s and found the 2011 tree-crown classification was 99 percent accurate while the accuracy for 2006 was 97 percent. “For the purposes of this project, we not only wanted to detect trees, we wanted to determine the size of individual trees to visibly show the difference in forest cover in five years, and to quantify that visible evidence with con- crete numbers of trees lost,” says Uddin. “That would have been impossible to do by manually counting trees.” With the land-cover maps completed, a small team from ICIMOD traveled to the Lorpa watershed to validate the accuracy of the 2011 map results with what was actually on the ground. Field teams manually assessed the vegetation at 60 randomly chosen sites and compared those findings to the land classification map. The overall accuracy was 93 percent, an impressive result – but not that surprising, says Uddin. “We knew the capabilities of the software and were confident that it could efficiently and accurately classify and map challenging terrain, so we weren’t that surprised by how well it performed,” he says. “Local authorities, however, were shocked.” Indeed, in presenting the vegetation change detection maps to both officials with the MoAC and the local district forest office there were audible “gasps” at the clearly visible deforestation in the watershed area. Many officials were under the false impression that forest degradation had been improved in recent years because of successful community forestry programs. The imagery of Lorpa definitively proved otherwise. As sobering as the realization was, Uddin says the authorities were impressed with the detail of the maps, which they plan to utilize to help devise forestry-specific management programs for the watershed area. The classification datasets were also used to help HIMALI project managers see how the vegetation changed over five years, enabling them to better understand the region’s roots of historic deforestation and watershed erosion. With that knowledge, they could prioritize investment areas and develop community-centric strategies to help the villages organically grow a healthier agribusiness – both for the benefit of their own livelihoods and the well- ness of the environment. “With the remoteness of the high mountain areas, it’s challenging for officials to obtain detailed information on ecosystems and the forest extent, and to measure that on a regular basis,” says Uddin. “This geospatial and image analysis approach enables us to cost effectively assess the ground view and map it repeatedly. That approach can help increase the awareness of the problems, support the development of appropriate management plans, and provide a low-cost means to monitor the success of those plans.” Indeed, for the Nepalese, believing what they’re seeing on the land-cover maps may not be enough to break their classic catch-22, but it may help them see the forest through the trees.
THE LIE OF THE LAND
what the present lie of the land in Lorpa looked like, but how its land cover had changed over time – specifically the forests. But given its geographic isolation, acquiring that picture with traditional, physical surveys would not be feasible. So HIMALI became the test case for a new approach to producing land-cover and change-detection maps in remote mountain valleys.COUNTING CROWNS
They acquired one 2006 QuickBird satellite image and one Ikonos image from 2011 for the change-detection land-cover maps. They also obtained a digital elevation model (DEM) from the shuttle radar topography mission (SRTM) for topographic detail as well as vector data such as buildings, roads and contours. As QuickBird and Ikonos have different resolutions, Uddin had to integrate the ancillary data with each orthorectified satellite scene to create two separate eCognition rule sets, the if-then processing trees that the software follows to determine specific vegetative types.SEEING TREES THROUGH THE FOREST
“Using a combination of satellite imagery and advanced land-classification technology, they not only produced two land-cover maps showing Jumla’s vegetation changes over time, they provided the visual truth to debunk some long-held, local beliefs that Jumla’s forests were not being lost to deforestation.”
A Crowning Achievement


