BY MATTEO LUCCIO / CONTRIBUTOR / PALE BLUE DOT LLC PORTLAND, ORE. / WWW.PALEBLUEDOTLLC.COM

FIGURE 1.
LIVE Maps mobile app shows real-time player location, score, rank and more for all PGA TOUR events, by Earthvisionz
Paper maps obsolesce rapidly from the moment they are printed, because the ink on the paper remains the same while the world changes—though faster in mid-Manhattan than in the middle of the Mojave Desert. Online maps can be updated frequently and some aspects, such as traffic, can reflect changes in real time. However, they rarely contain all the data and functions required to answer complex geographic questions, such as, “How many square miles of corn does the Kansas River watershed contain in Nebraska above 150 meters of elevation?” Using a geographic information system to answer such questions requires substantial training and access to all the right datasets.
By launching Google Earth (GE) a little more than 15 years ago, Google popularized a version of a digital or virtual Earth that requires neither training nor importing datasets to explore the entire planet—though at differing resolutions, roughly directly proportional to the amount of economic activity in each area. However, it allows users to perform only minimal geographic analysis, such as displaying elevation profiles, measuring distances and, with the Pro version, measuring areas.
Building on GE, Google Earth Enterprise (GEE) allows organizations to store and process terabytes of imagery, terrain, and vector data on their own servers, as well as to publish maps securely for their users to view using GE desktop or mobile apps, or through their own application using the Google Maps API. However, Google will stop supporting GEE in March 2017.
Many other vendors are also in the business of developing platforms that enable users to store, manage, visualize, and analyze geospatial data. As this series continues to explore these platforms, I discussed their offerings with the leaders of three companies that take very different approaches:
Carla Johnson, Founder and CEO of Earthvisionz, which makes location intelligence software that adds large datasets and live data to existing maps or virtual Earths; Mladen Stojic, President of Hexagon Geospatial, a geospatial software company that supports the internal business needs of its parent company, Hexagon AB, as well as those of Hexagon AB’s global network of more than 200 external partners, who use its technology to develop and deliver their solutions; and Perry Peterson, President and CEO of PYXIS, which has been developing a new standard Earth reference system, called a discrete global grid, promoting its adoption, and offering commercial products as well.EARTHVISIONZ
Carla Johnson’s first company, an environmental engineering firm called Waterstone, entered the geospatial world in the late 1990s, when it worked on the closing of the Rocky Flats plutonium trigger plant in Colorado. The project required coordinating many scientific experts and building public consensus on such things as soil and water data, human health and risk assessment, vegetation, and air quality. “The client was having a very difficult time trying to integrate all those different sciences into one conceptual model that people could use to make good decisions,” Johnson recalls. Her company created a common operating portal that allowed everyone to upload all of their data and maps and then see them together. “The bugs and bunnies people could look at the soil conditions, the water, and the different types of transport mechanisms that were out there.” This ability to visualize the contents of relational databases was new at the time.
Next, Johnson was an expert witness on one of the largest toxic tort litigations in U.S. history. There, again, she confronted the difficulty of making decisions on the basis of flat maps and data tables. “We made a 3D movie that allowed everyone to see, over time, how the contamination had entered into the soil, migrated into the aquifer, and contaminated this whole area outside of Scottsdale, Arizona. With that, we essentially won the case.”
This experience led Johnson and her team to start studying how the human brain consumes data. It led to work with NASA, which had just created a very rudimentary virtual Earth called NASA World Wind, and to a 2002 contract with the U.S. Air Force to develop 3D models. “We scanned every page of every document in 13 different Air Force libraries and georeferenced that information to the landscape via single clicks,” says Johnson. “During the Iraq war, it was a very useful platform for generals and colonels to use and it became a very popular platform in the Air Force to manage all of their assets and make decisions very quickly.”
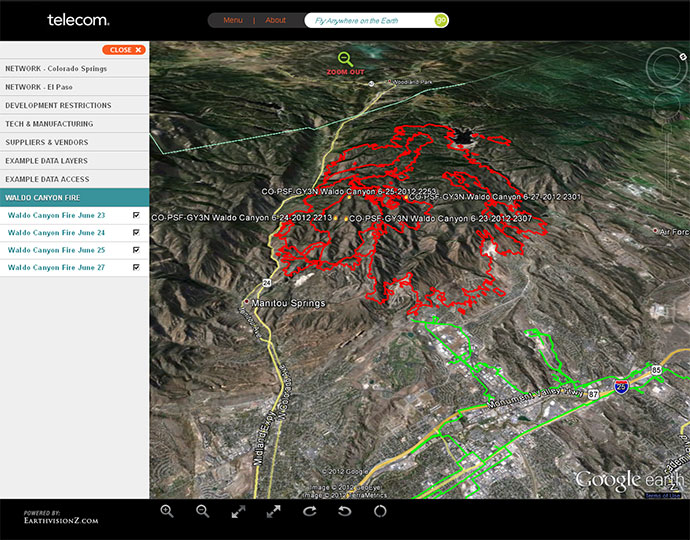
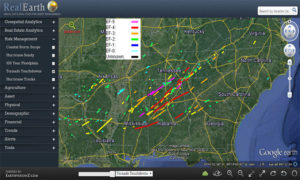
FIGURE 4. Earthvisionz application helps telecom data center see near real-time wildfire perimeter, 2012 Colorado Springs Fire
COMMERCIALIZATION
Earthvisionz then decided to commercialize its platform. It began by creating a product called Earthgamz, which aggregated all the sports on the planet onto a virtual Earth that combined e-commerce, social network, geospatial analysis, and live events. They then created platforms for charitable giving and for financial markets. In 2012, convinced that its platform was now robust enough, the company pivoted to creating its current suite of products, called Vast, which includes modules for visual learning, route optimization, fleet management, and live maps.
“It is not our business model to maintain a map or to service clients by making maps for them,” Johnson explains. “We take pretty much any map or virtual Earth that is out there and make it relevant.
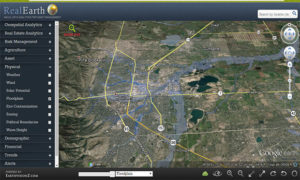
Our expertise is in georeferencing the data instantly, aggregating live links for all sorts of things—including local weather stations, solar panels, street cams, and any IOT device. Then, we integrate it all into a visual map-based dashboard, so that the user can have access to the data within two clicks and experience the world as close to real time as possible. You can download the product and get training on it within two hours, then access your data within two to three clicks. We call it real-time business.”
KEY MARKETS
The company’s current clients range from sports to emergency response and disaster management, from financial markets and banking to insurance and real estate portfolio management. “The key markets that we are going after right now are all interrelated,” says Johnson, “because we reduce risk, reveal opportunities, and help those businesses make better decisions faster on the first day of using the product.”
“The Internet and all the applications are slowly getting to a point where they can start to replicate the human experience,” Johnson explains. Reading, understanding, and interpreting charts, tables, graphs, and even maps takes time and it is alearnedprocess.However,wearebornintoa3D world, in which location is a part of every decision we make. “When you can put data into a quasi-3D or map view where it is relevant, your brain instantly understands the information and it actually produces endorphins, just like gaming. It is such an interesting and addictive thing for people on the Internet, because they are in this environment that is actually natural to them. That’s why I think the geospatial world is probably the most powerful part of the Internet.”
HEXAGON GEOSPATIAL
Mladen Stojic was hired by ERDAS in 1996 as an application engineer focused on photogrammetry. Later, as a product manager, he designed and developed several photogrammetry and mapping software products on top of the ERDAS IMAGINE and Esri ArcGIS platforms. He also began to innovate some new desktop server software in the area of visualization and what is now called ERDAS APOLLO for enterprise data management.
In 2001, when Leica Geosystems acquired ERDAS, Stojic moved to California to extend his product management responsibilities. When Hexagon acquired Leica Geosystems in 2005, he took over product management responsibilities for ERDAS. In 2010, when Hexagon acquired Intergraph, he managed the latter’s geospatial business and portfolio. He now runs the Hexagon Geospatial group, which consisted of all of Intergraph’s geospatial software.
FROM DATA TO INFORMATION
During his career so far, Stojic has seen a transformation in the industry from simply producing data to digging into them to provide access to the information that can be derived from geospatial content. “To facilitate this transformation,” he explains, “we’ve extended our portfolios in the geospatial industries from heavy desktop systems, and now a lot of this has migrated to the cloud.”
Hexagon Geospatial calls its cloud initiative Smart M.App. “We have synthesized and integrated GIS, remote sensing, and photogrammetry technology to support the development of light-weight, purpose-built, dynamic apps that deliver information services powered by geospatial content,” says Stojic. “If our partners build and sell an app through our M.App Exchange, they can make 70 percent of any unit of sale.”
Hexagon’s users can import their own data or connect to their data provider of choice via its platform. “We are data-agnostic,” says Stojic. “We have deployed more than 450 geoprocessing services that can operate against geospatial content.” For example, if requested by a partner, Hexagon’s platform could connect to a live data feed delivered via DigitalGlobe’s GBDX platform.
SHIFTING TO SUBSCRIPTION SERVICES
Hexagon sells licenses to all of its products individually. However, organizations can buy all of them at a discount as a producer suite or buy the portfolio as a subscription. “We are seeing a trend away from perpetual license purchases to subscription purchases,” says Stojic. In 2015, Hexagon launched online versions of some of its products, such as IMAGINE Online and GeoMedia Online.
“We’ve implemented a technology that pages those software packages onto the cloud while allowing you to use local data. Unlike with other GIS vendors, your data can be local. So, it is quite a different and novel approach.”
Increasingly, data providers also offer platforms and software companies offer content, narrowing the distinction between them. Hexagon does not buy data from Airbus, Terra Bella, BlackSky, Esri, or other vendors, Stojic points out, but it facilitates access to those content sources through its platform. “We believe that content partnerships are critical to the fusion of data and software.”
Hexagon Geospatial has a strategic partnership with Ordnance Survey (OS) and Stojic praises the latter’s “very long tradition and long-standing tradecraft in the areas of mapping, cartography, and surveying.” The two organizations are now working out how best to combine the OS’ content holdings with Hexagon’s M.App Portfolio.
FROM MAPS TO INFORMATION SERVICES
Hexagon Geospatial’s goal, Stojic says, is to provide “a holistic geospatial app platform that fuses content with software around a vertical market need, which can then be delivered and localized all over the world. It is a unification strategy of the industry which, unfortunately, over the last four decades has been siloed into GIS, remote sensing, CAD, BIM, and so forth.”
The volume of geospatial data is starting to become overwhelming, Stojic says. “Where we add value is in giving you the tools that allow you, as a partner or developer, to understand what you can do with the data and get the most out of them.”
The map of the future, Stojic often points out, is not a map. Maps take time and effort to collect, parse, analyze, and format the data, then to design, create, and publish the map—by which point the map is out of date. “What we need,” he says “is more of an information service. This service takes time to design, but because you are using building blocks to do your geoprocessing, building a prototype of the map can be done quickly. The map of the future will communicate, it will be alive, active, portable, and once it has served its purpose, it’s fast and easy to build a new service.”
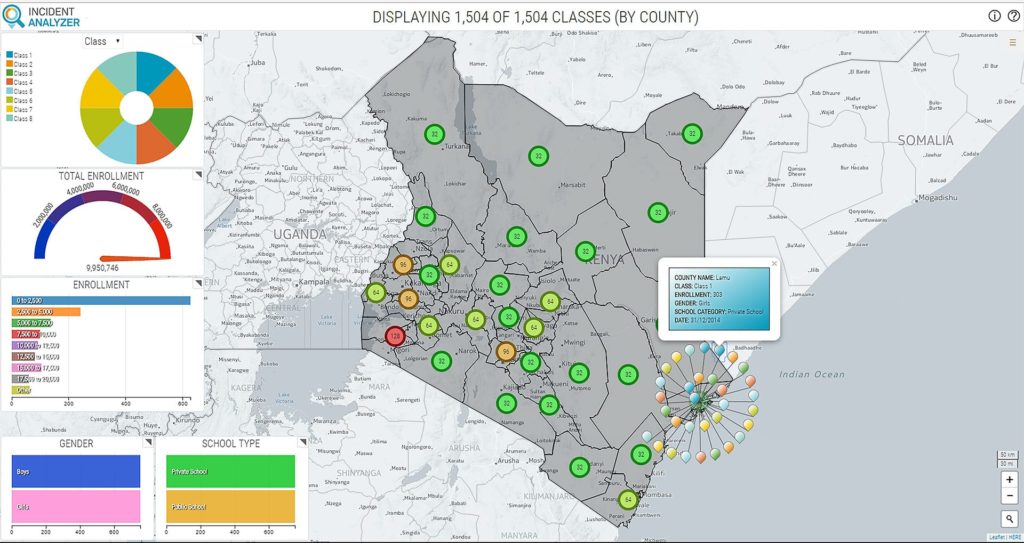
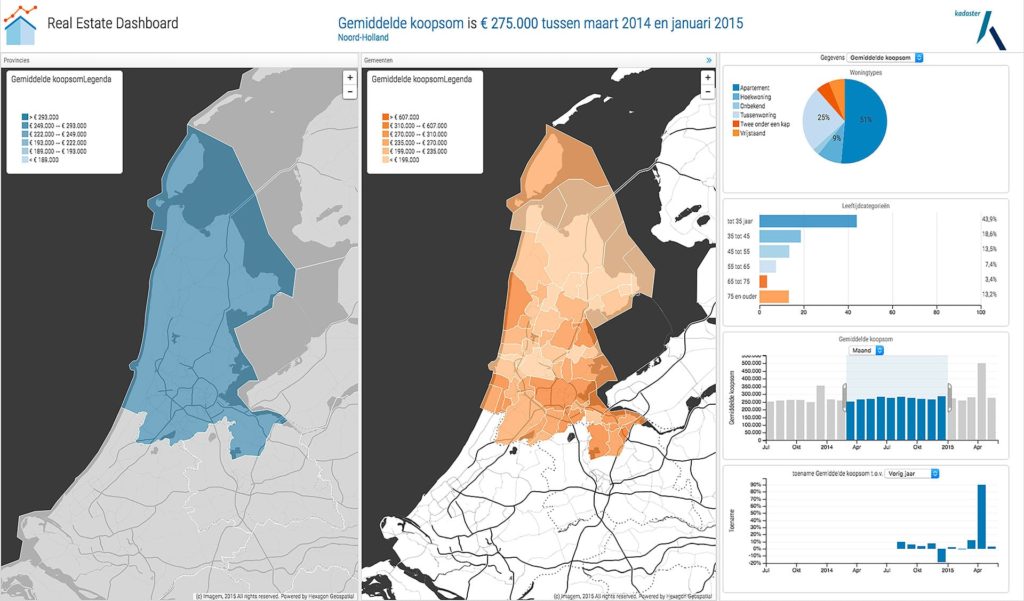
FIGURE 7. Hexagon’s Incident Analyzer app used to study income distribution in Johannesburg, South Africa
PYXIS
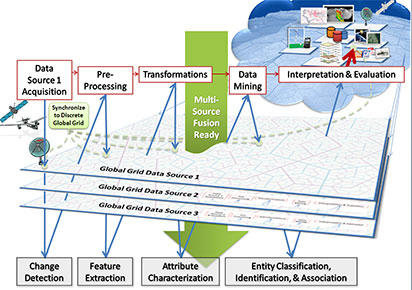
The big problem in geospatial technologies today, says Perry Peterson, is integration on demand: the ability to quickly put two or more geospatial datasets into a product that can be useful for decision makers, which currently takes a lot of work and expertise. PYXIS, he explains, has been developing a new type of Earth reference system called a discrete global grid system (DGGS) because it allows users to combine data quickly to answer the two basic geospatial questions: “Where is it?” and “What is here?” Instead of conflating to a particular data source, a DGGS is data-independent, allowing many data sources to reside in it and be gridded. “This enables a new generation of geospatial intelligence that we call ‘Digital Earth’.”
COVERING THE EARTH WITH CELLS
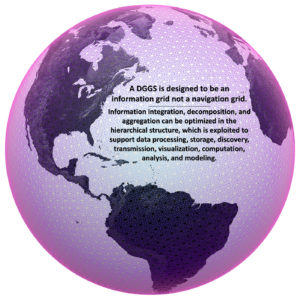
A DGGS is “a spreadsheet of cells that covers the Earth and in which you can put values,” Peterson explains. “When you zoom in, they refine hierarchically, potentially all the way down to atoms. Each cell has a unique address and has a parent-child relationship with other cells, which enables users to aggregate and decompose information very fast. It is very, very simple.”
PYXIS’ DGGS harvests data values from standard GIS, raster and vector, sources. Users can bring into a cell imagery, coverage data, rainfall, soil moisture, geospatial statistics, etc. “We are really about enabling people to ask their unanticipated geospatial questions and get answers. You can’t do this using a conventional spatial reference without a very complicated manual process of fusing different data sources.
“Increasingly, data providers also offer platforms and software companies offer content, narrowing the distinction between them.”
One would have to build a vector map, at every scale, including every feature, over the entire world, and update it continuously, to meet these requirements.”
A little more than a decade ago, when Google was about to launch Google Maps, it needed to settle on a projection. In order to solve the problem of getting route maps fast, it chose Web Mercator, which is great for that purpose. Unfortunately, however, it is among the worst projections in terms of distorting angles and distances. “Therefore, if you are going to do analysis,” says Perry, “you should take that Web Mercator and re-project it on something that is more suitable, such as an equidistant or equal area grid. PYXIS is giving people the ability to go beyond Web maps to do their own spatial analysis without the assistance of GIS and at speeds that are acceptable on Web applications.”
ANSWERING COMPLEX GEOGRAPHIC QUESTIONS
The early forms of DGGS were first developed in the mid-1980s, when the promising value of global analysis coincided with the increased use of GIS and the availability of global mapping data and positioning systems. The pioneers of the system convened at the First International Conference on DGGS in March 2000. When PYXIS began working on it, in 2003, the basic ideas had been worked out but there remained more basic and advanced computer science, mathematics, and engineering to complete, including indexing, fast processing, graphics, and ideal user interface. “We spent more than eight years and $10M on R&D,” Peterson recalls. “Most of this was provided by the Canadian government, through military and other programs, and by our very patient investors.”
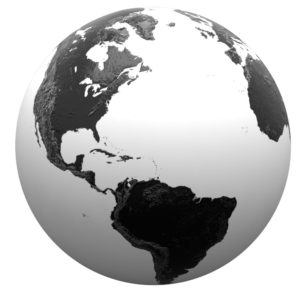
A DGGS enables many “cool applications,” Peterson says. “One of them, which we call the WorldView Studio, is black & white because we want people to create their own globes as a canvas. It can pull in vector and coverage data from disparate locations, including Esri REST and OGC services.”
The Studio can answer complex geographic questions, such as the one in this article’s lead paragraph. To demonstrate this, Peterson uses elevations from GTOPO30 data to delineate the watershed, a vector data file of North American rivers, and a USDA dataset called cropland data layers, which is in a Web coverage service. The program consolidates the information and reports that the average elevation is 481 meters, the maximum elevation is 1,709 meters, the watershed is 149,000 sq km, and there are 36,000 sq km of corn contained in Nebraska above 150 meters of elevation in the Kansas River watershed.
To look for current precipitation, he uses a feed from NOAA and looks at elevations between 400 and 1,000 meters. Instantly, the system reports that the area covered by crops is now down to 11,000 sq km. He then narrows his selection to just corn crops.
Finally, to do some climate change modeling, Peterson brings in the average mean temperature as of 2015, which was 11.6 degrees Celsius in that watershed, and a climate change model that he trusts. It tells him that the temperature will rise by about three degrees over the next 35 years, assuming no change in carbon output.
The system updates progressively, which means that the longer you wait, the better the resolution. “That is how we can have online speeds that are close to Web mapping speeds, allow analysis anywhere on the planet, and meet the speed requirements that users are anticipating without giving them false answers,” Peterson explains. At any point, a user can share a link to the analysis with another user, who can then change some or all of the previous user’s selections.
While PYXIS developed DGGS with funding and scientific support from USGS, NASA, NGA, and U.S. and Canadian militaries, it is so easy to use that ten-year-old kids can do wonders with it, says Perry. Recently, he was alerted that somebody who exemplified a “super user” had logged on and within two hours had done a very complex analysis with many, many datasets. “It was amazing what this person had been able to accomplish,” he recalls. When the same person logged on again a couple of days later, Peterson was able to find out who it was: “It was an 11th grade student in Alabama,” he says. “When the kids get into the workforce, they will be expecting this.”
CONCLUSIONS
The diversity of geospatial intelligence requirements continues to drive a variety of approaches to the collection, storage, management, visualization, and analysis of the exploding amount of geospatial data available. Each of the three companies profiled in this article has developed a unique approach to these challenges and a unique set of offerings to the geospatial community.
NEWSFLASH:
Google Earth Enterprise
Becoming Open Source
On January 30, 2017, Avnish Bhatnagar, Senior Technical Solutions Engineer for Google Cloud, in a blog post, announced that Google will open-source Google Earth Enterprise (GEE). “With this release,” he wrote, “GEE Fusion, GEE Server, and GEE Portable Server source code (all 470,000+ lines!) will be published on GitHub under the Apache2 license in March.”
Launched in 2006, Google Earth Enterprise provides customers the ability to build and host private versions of Google Earth and Google Maps. In March 2015, they announced the deprecation of the product and the end of all sales, with support promised until March 22, 2017.
However, Bhatnagar explained that Google has heard from its customers that GEE remains in use in mission-critical applications and that many of them have not transitioned to other technologies. “Open-sourcing GEE allows our customers to continue to improve and evolve the project in perpetuity.” He added that the implementations for GEE Client, Google Maps JavaScript API V3, and Google Earth API will not be open-sourced.
Moving forward, Google is encouraging GEE customers to use Google Cloud Platform (GCP) instead of legacy on-premises enterprise servers to run their GEE instances. For many customers, GCP provides a scalable and affordable infra- structure-as-a-service where they can securely run GEE. Other GEE customers will be able to continue to operate the software in disconnected environments.
This series of articles began in the Fall 2015 issue in direct response to Google’s announcement that it would stop supporting GEE to offer readers alternatives and options. Future installments in the series will cover the effort to open-source GEE as well as the way other platforms are used to manage, analyze, and display geospatial data.
More details are available at bitly.com/opensourceGEE.


