Editor’s Notes: This article is an excerpt from the book GIS for Science: Applying Mapping and A Spatial Analytics originally published by Esri Press, Redlands, CA. Copyright 2019.
The companion website is www.gisforscience.com/chapter12/v1/.
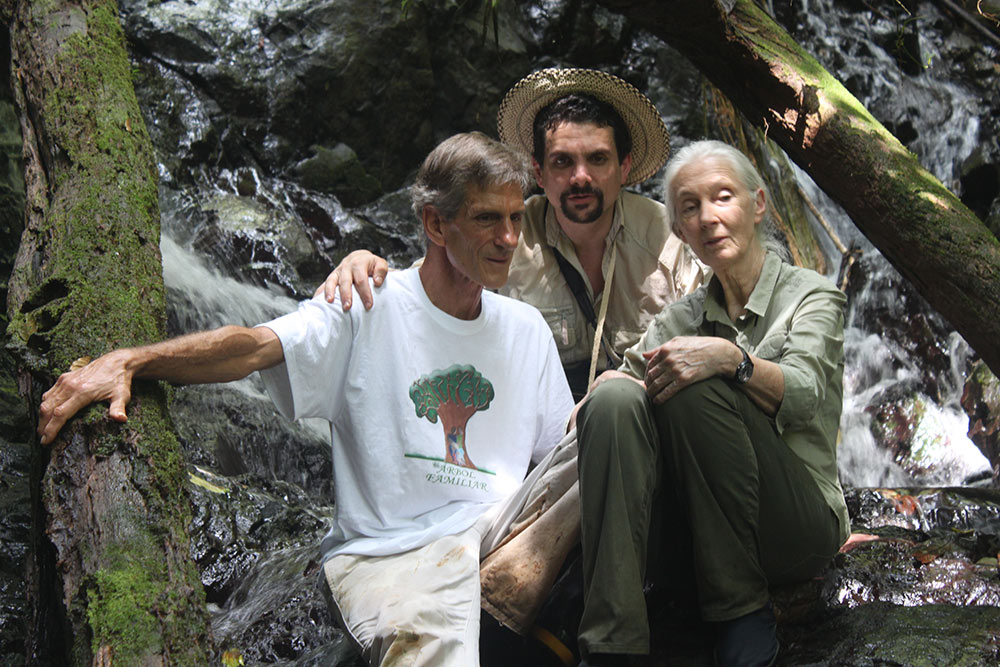
Jane Goodall pictured with Lider Sucre (then Co-Executive Director of Earth Train, now CEO of Mamoní 100) and Nathan Gray in 2012 during a 5-day gathering of Jane Goodall’s Roots & Shoots youth leaders of the Americas, held at Centro Mamoní, Geoversity’s science center in the Mamoní Valley Preserve.
A Personal Introduction to PanaMapping
by Nathan Gray, Founder of Geoversity, October 22, 2019
I’m in the rustic dining room of our science center at jungle’s edge in the 12,000-acre Mamoní Valley Preserve in Panama fussing with my laptop so that our special guest, Dr. Jane Goodall, can open the plenary session for the 2,000 educators and scientists participating in the First Annual Conference of the Association for Environmental Studies and Sciences (AESS) taking place in Madison, Wisconsin. I’m explaining to my counterpart 4,000 miles away, University of Redlands professor and first AESS president Monty Hempel, that the limited bandwidth of our satellite service will permit voice only. This was my first conversation, in October 2009, with someone who would soon become a dear friend and, years later, play a key role in creating the Geoversity ecosystem.
“Nathan, what the hell is all of that racket I’m hearing in the background?” Monty asked. I replied with a laugh, “That pepper grinder sound is a pair of keel-billed toucans cackling in a tree right next to us. And that barking sound you’re hearing is a tribe of howler monkeys that just started marauding among the fruit trees on the nearby hillside.” Jane, with a big grin on her face, sits down in front of the computer, leans toward the microphone and, with Mother Nature’s inimitable soundtrack in the background, begins to speak. Later, Monty would tell me that a hush came over the giant auditorium where they were gathered before a giant screen with pictures of Jane exploring the Mamoní forest. “You could hear a pin drop,” he said. “The excitement was palpable.”
With Monty come many stories of unusual conversation and adventure, such as hiking and paddling with indigenous leaders from our preserve on the Pacific side of Panama’s continental divide across the autonomous territory of the Guna people to their Atlantic coast. But here, I’ll keep it to just a word of thanks to Monty for bringing in his colleagues at the University of Redlands in California, and their groundbreaking Center for Spatial Studies to help start the Geoversity ecosystem in 2016, and for launching the PanaMapping project introduced in this special issue of Apogeo Spatial. Quoting him is my way of introducing the topic while acknowledging his contributions of clarity and insight. You’ll see why we so value his role in Geoversity with our odd mission of “creating contexts for miracles and, ultimately, bringing about a global biocultural renaissance.”
“Mapping a watershed or rainforest ecosystem is like drawing a floorplan for one’s home. It seems rather prosaic, when in fact it is how we visualize complex information needed to develop a systems understanding of our environment. The PanaMapping project, with its reliance on advanced geospatial and drone technology, makes it possible to integrate the human perspective of ground-level fieldwork with the avian perspective of interlocking ecosystems. Together they help transform our understanding of the system of systems that is Nature and the interdependence that characterizes all life on Earth.”
–Monty Hempel
PanaMapping is about how geographic information system (GIS) technology supports conservation goals in Panama by revealing how physical features of the landscape interact with human uses of the land. The Mamoní River defines the watershed in which the Mamoní Valley Preserve (MVP) works to conserve forests, streams, and the biodiversity and human communities that depend on them.
Forests of the humid tropics shelter biological and cultural diversity, protect watersheds, and sequester carbon from the atmosphere. However, they are threatened by deforestation and climate change, and so conserving them often requires strategies to protect critical areas while promoting resident human communities that are invested in conservation and sustainable uses.
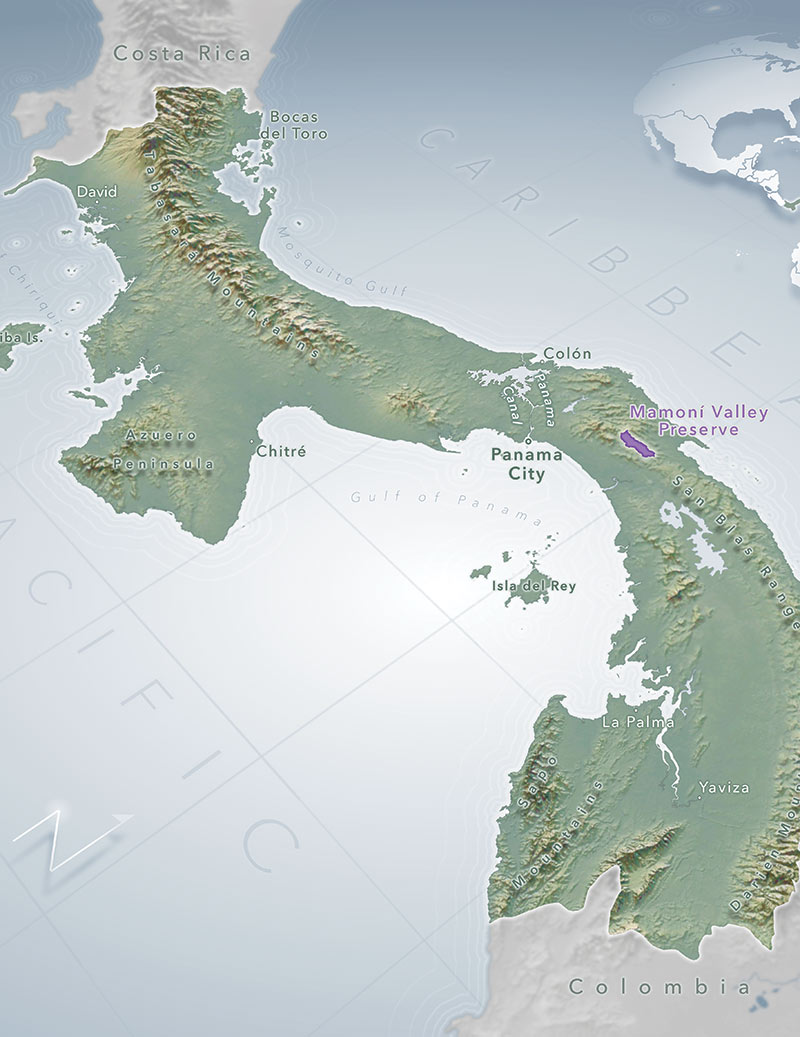
Figure 1. The isthmus of Panama is the narrow bridge of land that connects North and South America, and includes more than 1,600 islands off its Atlantic and Pacific coasts. Panama is most known for the Panama Canal, which cuts through its midsection.
In an ongoing series of field courses starting in May 2017, undergraduate students, faculty, and GIS professionals from the University of Redlands have been working in Panama with the Mamoní Valley Preserve, using GIS to support the reserve’s goal of conserving biodiversity while promoting local culture and a sustainable local economy. Working in micro-watersheds defined by tributaries of the Mamoní River, each field course conducts parallel and overlapping research projects.
These include: global positioning system (GPS) mapping of trails and watercourses and micro-watershed boundaries, collecting original high- resolution 3D land cover data with unmanned aerial vehicles (UAVs), land cover mapping, carbon mapping, and watershed analysis. Over time, the idea is to build a thorough geographic database of increasing value for reserve management.
The Conservation Problem in the Mamoní Valley Preserve
Field courses at the University of Redlands examine a valley that is both a conservation priority and also representative of people-forest dynamics elsewhere in the humid tropics. The upper Mamoní Valley watershed covers approximately 121 square kilometers (29,900 acres) at the narrowest part of the Americas. A line drawn through the preserve from the Pacific north to the Atlantic would be only 60 km long (37 miles) and so conserving it widens the Mesoamerican Biological Corridor, a thread of land connecting North and South America. The valley acts as a buffer to the Chagres National Park and the pristine Guna Yala Comarca; it buttresses the Tumbes-Chocó- Magdalena eco-region—one of the top 20 ecological hot spots on Earth.
The valley shelters the full complement of tropical forest mammals, including jaguars and four other species of wildcats, two species of sloths, several kinds of monkeys, and abundant snakes, lizards, and amphibians. Scientists from Harvard University and elsewhere have observed 290 species of birds here. The valley also appears to be a refuge for species of frogs decimated by disease elsewhere in Panama, and the Smithsonian Tropical Research Institute’s Amphibian Recovery Unit studies remnant frog populations and restoration techniques.
Recent history has turned the valley into a mosaic of pasture, 15- to 30-year-old secondary forests, and stands of old-growth forest. Starting in the 1960s, small-scale farmers and cattle ranchers began clearing forest in the valley. A rough road entered in the 1980s, and deforestation pressures began to leak out of the Mamoní Valley as settlers and the hired hands of absentee landlords crossed the continental divide into indigenous Guna territory to clear fresh lands for food crops and pastures.
In a well-known example of indigenous resistance, the Guna people demarcated their lands and spent many years firmly evicting settlers from homesteads in Guna territory and turning back settlers at their border with the Mamoní Valley. In the last several decades, subsistence agriculture and small-scale cattle ranching became less economically viable, and some families began to abandon the valley. This created the threat that large-scale cattle ranchers would consolidate smaller properties and convert much more of the valley to pasture.
In 2000, in coordination with the Guna people who were looking for allies to stabilize their frontier, Nathan Gray, a social entrepreneur and sustainable development activist, established a Mamoní Valley campus of Earth Train, an environmental youth leadership training organization he had founded in 1990. Earth Train recruited allies to buy strategic parcels of forest and pasture to prevent the consolidation of pasture lands into large-scale cattle operations.
These actors in 2001 established the Mamoní Valley Preserve, a 501(c)(3) nonprofit organization using the tools of landownership, conservation easements, and landowner pledges to conserve the extent and quality of the valley’s forests and waters, to strengthen biodiversity, to improve the health of the forest’s inhabitants, and to promote a sustainable local economy. Currently, the reserve has the explicit support of the landowners in possession of about half the valley. The goal, however, is to extend forest conservation and sustainable development to the entire upper Mamoní River watershed.
GPS: From Footprint to Map
Using GPS, students turned walking into a mapping activity. They quickly realized the need for more detailed location data on the trails, watercourses, ridgelines, and watershed boundaries of the area. They became aware of the limitations of the GPS units, especially under heavy tree canopy. A discussion of GPS accuracy and precision ensued with a decision to smooth out the trails and watercourses to account for the lack of accuracy in areas of dense forest. See Figure 2.
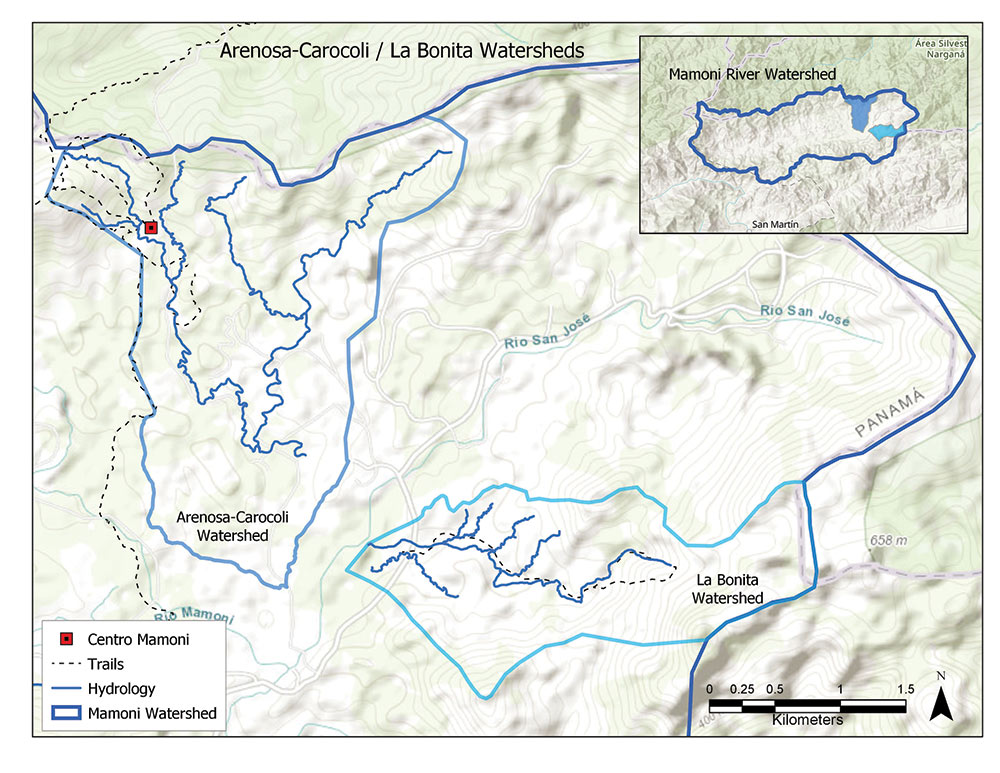
Figure 2. In addition to the trails and watercourses noted, two micro-watersheds, the Arenosa- Caracoli and the La Bonita, have been delineated, forming the basis for the research in the valley.
UAVs: A High-Resolution View from Above
To truly appreciate the complexity and diversity of the rain forest, you must immerse yourself in it and experience it—but to understand the structure and health of the rain forest, you need to get above the tree canopy and see it on a much broader scale.
Two DJI Phantom 4 Professional UAVs were used to acquire roughly 4,500 photos above the study area. The Phantom 4 Professionals have a 1-inch 20-megapixel sensor for a high-resolution product and also a mechanical shutter to eliminate the distortion often introduced flying at higher speeds with a rolling shutter.
Flight planning was done using Pix4Dcapture on an iPad at the headquarters in Centro Mamoní with internet connectivity, but changes were regularly made in the field due to changing conditions. Consumer flight planning apps such as Pix4Dcapture require that missions fly at a constant altitude above the takeoff point, set by the operator.
The image resolution and overlap calculations are made based on this altitude and assumed constant because the UAV isn’t aware of the changing ground elevation underneath it. This presents a challenge when mapping a large area with varying terrain because the elevation of the ground under the UAV is changing and therefore the image overlap and resolution is difficult to plan for. To resolve this issue, missions were planned in “terraces” following topo contour intervals.
Pix4Dmapper was used for processing – a photogrammetry software for generating and analyzing orthomosaics and other mapping products from images collected via UAV. Students ultimately used a combination of Pix4D-generated orthomosaics and the photo points layer with linked photos to complete tasks such as land cover classifications. These were imported into an ArcGIS mosaic dataset with time stamps. This dataset now covers roughly 9.25 square kilometers of high- resolution aerial imagery and can be used for further research and land management.
Land Cover Maps
To produce a land cover map, researchers worked with a professional forester familiar with the area. They learned to understand and recognize forest stands and chronosequences. A forest stand is a community of trees generally similar in composition and age, while a chronosequence is the series of successional phases a forest stand goes through as it recovers from a disturbance such as being cleared for agriculture. See Figure 3.

Figure 3. Land cover maps showing a sequence of land cover types found in La Bonita, ranging from pasture through different ages of forest regrowth, including areas of very old, late successional forest, revealing a landscape shaped by a history of deforestation for pasture in valley bottoms and forest conservation in the more remote headwaters of streams.
Carbon Sequestration and Forestry: How to Measure Carbon
Carbon emissions from deforestation are a major contributor to global greenhouse gas emissions, while growing forests sequester carbon, and so conserving forests provides an important environmental service. Mamoní Valley Preserve managers wish to visualize and communicate how much carbon they are managing and where it is located. Carbon maps could also tell them where to concentrate conservation efforts to avoid carbon emissions from deforestation, and where they might best invest in reforestation projects that could sequester carbon from the atmosphere.
Students gathered data from sample plots, including the height and diameter of all trees within the plot. They entered the data into a spreadsheet and calculated the volume and carbon content of the trees in each fixed area plot. The forester selected plots to represent the various land covers.
Students used GPS data to confirm the correspondence of sample plots with their land cover map and then took the average of the results from the plots in each land cover type. They then assigned the average carbon content value to each land cover. Finally, they joined the carbon value data with the land cover data to produce a new map representing the distribution of carbon within each watershed studied. See Figure 4.
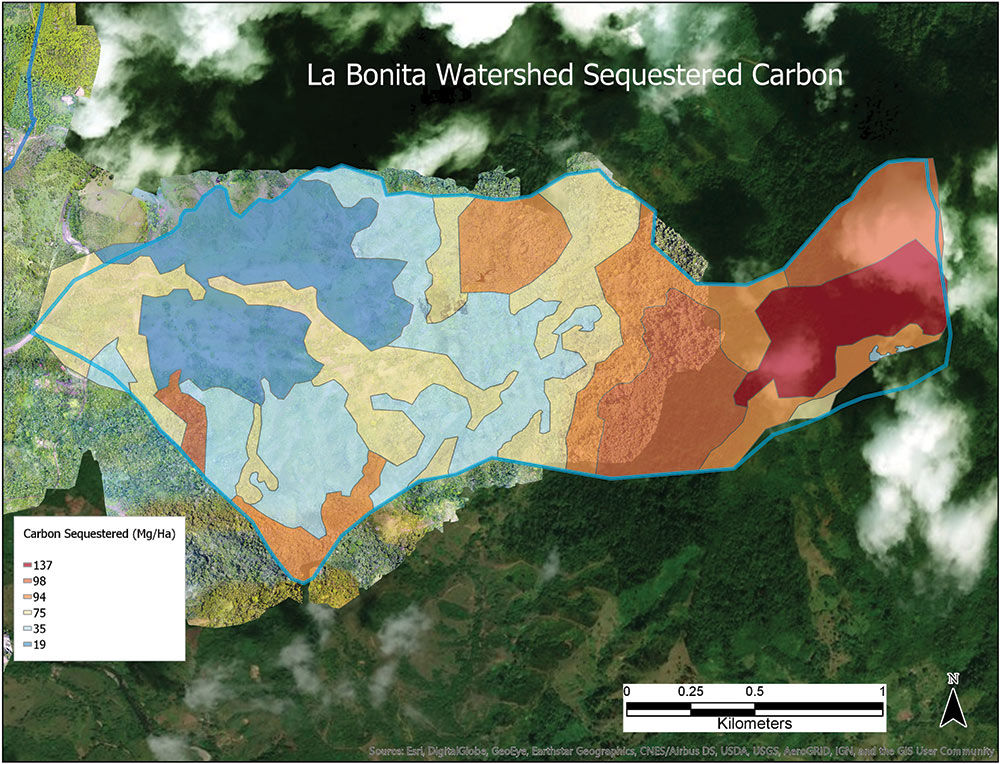
Figure 4. The carbon maps indicate the highest carbon density is found in the oldest forests in the headwaters of micro-watersheds, and the least carbon is in the pastures.
Watershed Analysis
Efforts to conserve and improve the forests and waters in the upper Mamoní Valley watershed require an understanding of the watershed dynamics at the micro-watershed level. As such, students analyzed the erosion vulnerability of each micro- watershed by answering six questions for each one, including locating boundaries, the main stream and tributaries, the riparian forest buffers, forests and pastures, and slopes and flat areas.
The first step is delineating the micro-watershed by analyzing a digital elevation model (DEM) to identify initial watershed boundaries. Second, students mapped riparian barriers by performing visual analysis of the UAV orthomosaic. The third major component was to visualize and represent the topographic shape of the watershed. Using the DEM, students created vertical profiles showing the descent of the major stream and the shape of cross sections at various points along the valley. Fourth, students combined the slope map with the land cover map. Students were able to locate areas of special concern, such as steep slopes under pasture or early forest regeneration. See Figure 5.

Figure 5. This map shows where pastures are found on very steep slopes – the areas that are most vulnerable to erosion. These areas could be the focus of reforestation efforts.
Results
Each of these projects helps MVP managers meet their goal to conserve the extent and quality of the valley’s forests and waters. The land cover map helps them more easily visualize the locations of target land cover types such as old growth forest, to correlate land covers with other data such as elevation and slope, and—by repeating the process with land cover data from different time periods—to quantify and visualize change over time. Carbon mapping reveals that the micro-watersheds so far studied store significant amounts of carbon; that most of this carbon is in relatively remote, higher elevation areas spared deforestation during the twentieth century; that there are many areas where young growing forests are capturing carbon; and that many pasture areas are potentially available for carbon- capturing reforestation projects.
Micro-watershed mapping locates essential management units in which managers can now develop, compare, and monitor useful new indices such as the percentage of a micro-watershed covered by pasture or forest.
GIS for Conservation Education Conclusion
Students are building an enterprise GIS for the Mamoní Valley Preserve, including land cover, watershed analysis, landownership, carbon storage, hydrology, and trails. Their use of GIS tools contributes to conserving the rain forest, but at the same time it also advances students’ education in conservation science.
GPS mapping gets students into the forest, walking along trails, tracing ridgelines, and wading in creeks. It teaches an important data entry skill for GIS and promotes concrete appreciation for accuracy and precision—students become savvier, appropriately critical users of spatial information. Flying UAVs also gives students additional experience integrating original data into a GIS while introducing optical remote sensing and a compelling new geospatial technology.
Using GIS to analyze watersheds, students think about the connections in a landscape. They visualize links between land cover, slope, and erosion. They consider the role of riparian barriers in buffering streams from the runoff from cattle pastures. Using GIS to map forest carbon provides additional learning opportunities for them. Tasked with answering the question “Where is the carbon?” students work backward, first developing an understanding of the science of forest succession in a temporal, nonspatial sense, then developing basic skills in the science of forest mensuration. As they create and interpret land cover maps, they learn about the social process of deforestation, conservation, and forest recovery. In Panamapping, GIS becomes a powerful vehicle of scientific education.

With the direction of indigenous leaders, the students and faculty of University of Redlands are using GIS and UAVs to document processes of deforestation that threaten both conservation and the indigenous rights to land and livelihood.
GIS in the Struggle for Conservation: Supporting the Majé Emberá Indigenous People
It is dark and there is no electricity. Students crowd around a makeshift table under a palm-thatched roof. Only our headlamps illuminate the map we are using to plan tomorrow’s UAV flight. Dressed in his traditional garb, Cacique (Chief) Lorenzo points out the village site to University of Redlands UAV pilots. He shows us where ancestral lands were flooded out in 1976 to provide hydroelectric power to Panama City. “We had to give up our lands so the rest of the country could have electricity, but we don’t have electricity, or water, or even rights to the remnant of our territory that we live on,” Lorenzo tells his visitors. With his finger, he traces the watershed boundary on a map.
Lorenzo points out areas where his people used to collect medicinal plants to support pregnant women and to cure the sick. Many of those areas are deforested now. The problem, he explains, is that his people’s remaining lands have been declared a conservation area, and this means they cannot officially own them, protect them, or manage them. But conservation authorities don’t protect the lands from ranchers and loggers. Settlers have cleared large areas of pasture near the village, and a fire set to clear forests for pasture spread into the valley of the creek that the Majé Emberá use for drinking water, destroying their aqueduct.
Cacique Lorenzo’s map was produced by the Danish NGO Forests of the World, and it shows areas of land cover change calculated using radar remote sensing from a European Space Agency satellite. Visitors from the University of Redlands are there to support the Majé Emberá by gathering data to help verify and illustrate the larger image. Lorenzo asks them to use their UAV to document a recently deforested area and gather UAV data showing a forest he knows will soon disappear. The Majé Emberá will use the UAV imagery to support their ongoing campaign to defend their territory from encroachment and to help them lobby the Panamanian government for land rights to defend what is left of their ancestral territory. University of Redlands students, meanwhile, are seeing the role GIS can play helping indigenous people engaged in conservation struggles. See Figure 6.
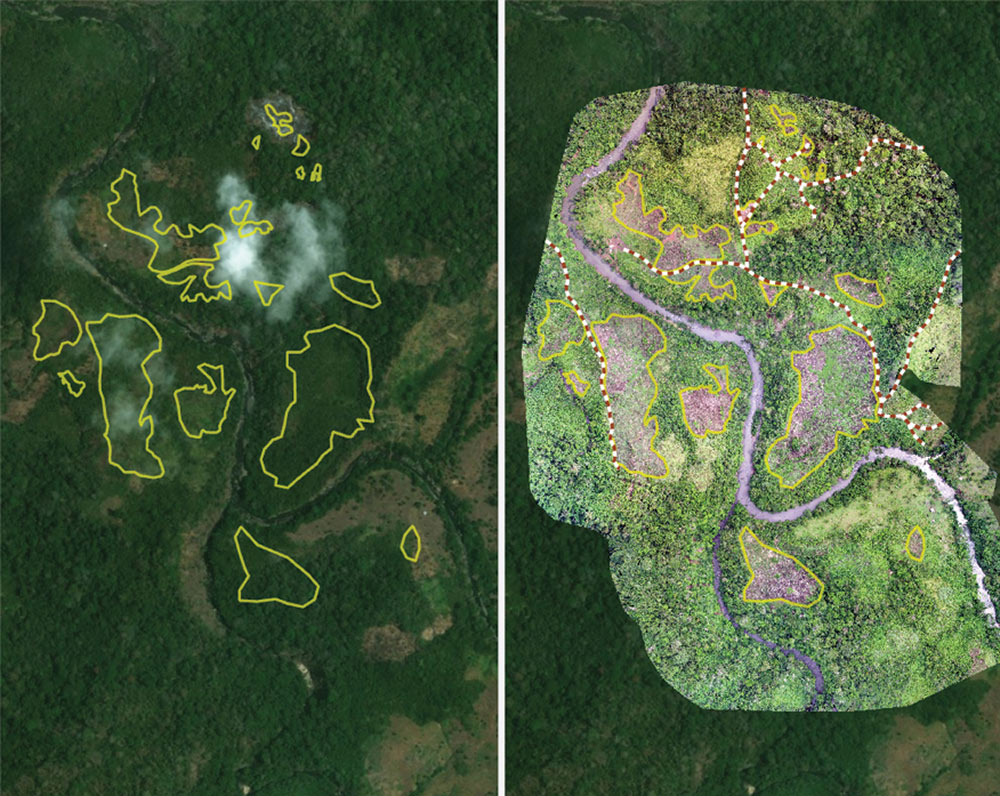
Figure 6. UAVs were used to document illegal deforestation and road building in Majé Emberá lands. On the left is 2016 imagery from ArcGIS Online, with polygons showing the forest cover lost by May 2018. The right image is UAV images from May 2018 verifying the deforestation and roadbuilding