Prof. Hans-Peter Plag, PhD
Mitigation and Adaptation Research Institute
Old Dominion University
Norfolk, Va.
www.mari.odu.edu
In the planning of our cities, infrastructure, economy, communities, etc., we trust that we have a fairly reasonable picture of what might happen in the future. Very little attention is on redundancy that could help us if the unexpected happens. Like many before us, most members of our modern society trust that we have nearly complete knowledge and do not worry about, and do not prepare for, “hidden risks.”
To better understand the importance of acknowledging knowledge gaps, let us look at the challenge of sea-level rise (SLR). Since the beginning of this century, we have seen a rapid development of our knowledge about what is contributing to the current global SLR, and how global sea level may change in this century. The assessments of the Intergovernmental Panel on Climate Change (IPCC) always include trajectories for global sea level during the 21st Century. There are some changes from report to report, but the main picture remains the same: global SLR during the 20th century was larger than in previous centuries, the rate of SLR continues to increase, and by the end of the century, sea level will be significantly higher than today.1
Around the beginning of the 21st century, several scientific studies attributed most of the global SLR during the last few decades to an increase in the heat content of the oceans, which results in warmer water with a larger volume, hence a rise in sea level.2 Another fraction of the SLR was attributed to melting glaciers. The contributions from the Greenland Ice Sheet (GIS) and Antarctic Ice Sheet (AIS) were considered to be minor.
The Gravity Recovery and Climate Experiment (GRACE) satellite that started in 2003 provided excellent observations of mass movements in the fluid envelope of our planet. As early as in 2005 and 2006, the analysis of the GRACE data showed that both the GIS and AIS were losing mass and contributing to SLR, and in 2009 it became clear that these contributions are accelerating.3 Subsequent analyses confirmed the accelerating trends.
Last November, the National Research Council (NRC) published a report on Abrupt Climate Change Impacts4 and considered the known threat of a collapse of the West Antarctic Ice Sheet (WAIS), which would cause a global SLR of about 4.5 m. The report concluded that the probability of this collapse starting in the 21st Century as very low. However, a few months later, in May this year, two articles were published providing evidence that the WAIS collapse has started and its retreat is irreversible: the WAIS is melting and will contribute some 4.5 m to global SLR.5,6 The question is only how fast this will happen.
Both the IPCC assessment and the NRC report express high confidence that there is no instability that could lead the GIS to contribute rapidly to SLR. However, in May we also saw an article that changed this view: the discovery of deep submarine valleys reaching far inland under the GIS7 introduces the possibility of rapid melting of much larger parts of the GIS than previously thought possible. And, before the end of May, another article made the threat from the ice sheets more tangible: Several meltwater pulses during the last deglaciation 20,000 to 9,000 years ago raised global sea level rapidly, sometimes more than 15 meters within 300 years.
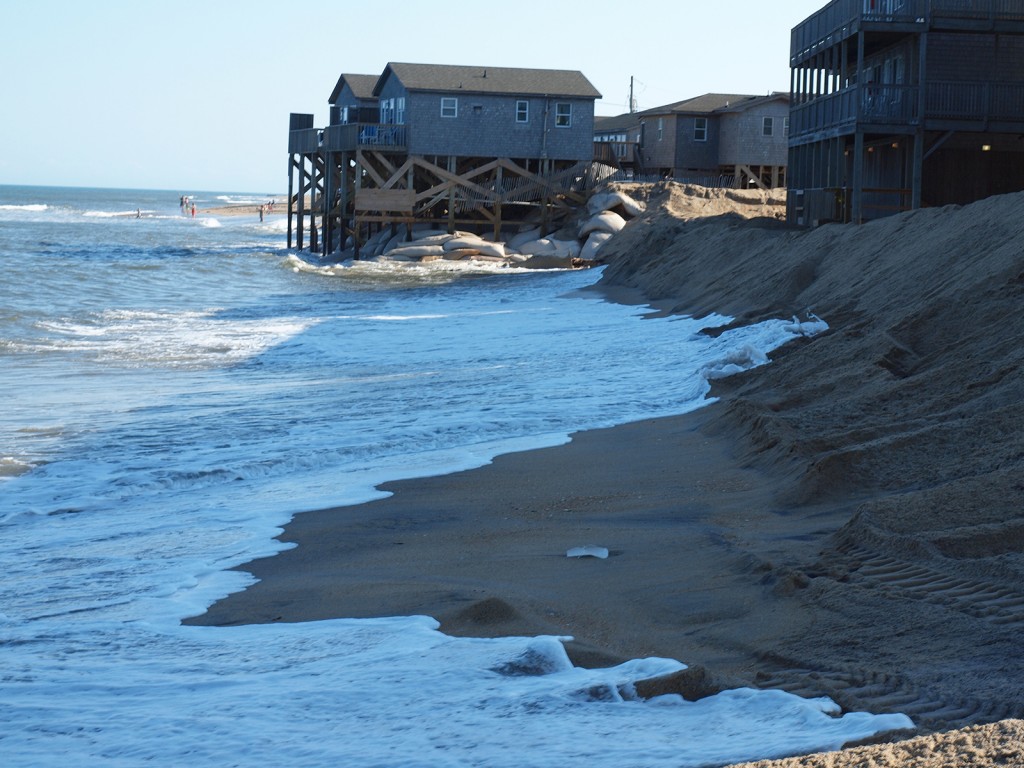
FIGURE 1.
Using sandwalls and sandbags to protect infrastructure against the rising sea is not a viable form of adaptation.
It was generally thought that these pulses came from the melting of the large ice sheets in Scandinavia and North America. The article published in May links the pulses for the first time to major contributions from the AIS.8 What has happened in the past could happen again. We still do not know why these pulses started and why they stopped. However, they happened at a time when changes in ocean heat content and air temperature were much slower than today. Under today’s rapid transition out of the Holocene, meltwater pulses from the AIS or GIS cannot be excluded.
This brief review of how our knowledge changed over the last decades can be taken as an indication that there are still many knowledge gaps. And these gaps are bridged by assumptions and opinions that have a high probability to turn out wrong (as they did over the last two decades). In the discussion of climate change impacts, we often denote knowledge gaps as “epistemic uncertainties” and we do not explore the full range of what might happen. We display an almost “willful blindness” to the worst case, and call those who don’t alarmists. The response of the large ice sheets to the on-going global warming is a very good example of this normalcy-biased approach to what could turn into an existential challenge for our civilization: learning to live with, and live in, a variable, transient coastline and coastal zone.
In most parts of the world, coastal settlements are organized and coastal infrastructure is designed based on the fundamental assumption that sea level does not change much over time and the coastline is basically fixed. Opening our minds for the possibility that rapidly melting ice sheets could cause rapid increases in sea level and large horizontal progressions of the coastline would require a paradigm shift for the way we live in the coastal zone. We would have to find new ways of how we define private real estate, how we plan the urban coast, and how we design our coastal infrastructure for services such as transportation, communication, power, water, food, sewage, and health.
It does not look like we are ready for this paradigm shift. Many of us rather attach low probabilities to the range of sea level rise that would require fundamental (and expensive) changes, and most of us are not open to look at worst-case scenarios to fully comprehend the risks. In particular, quantitative “hard” scientists have problems communicating knowledge gaps—they are supposed to know, not to not know. How we “fill” the knowledge gaps depends on our personal context, our value system, our preferences. Since self-reflection is not a particular strength of natural scientists, we do not analyze how our psychological, social, and political preconditioning impacts our handling of knowledge gaps.
Not considering the worst case and ignoring the huge risks associated with the tail of the risk spectrum carries the danger that things could turn out much worse than what the many assessments on global to local levels consider likely or plausible. Combining the IPCC assessment with the most recent findings about the large ice sheets, we can be rather sure that things will turn out much worse than many of us thought a short time ago.
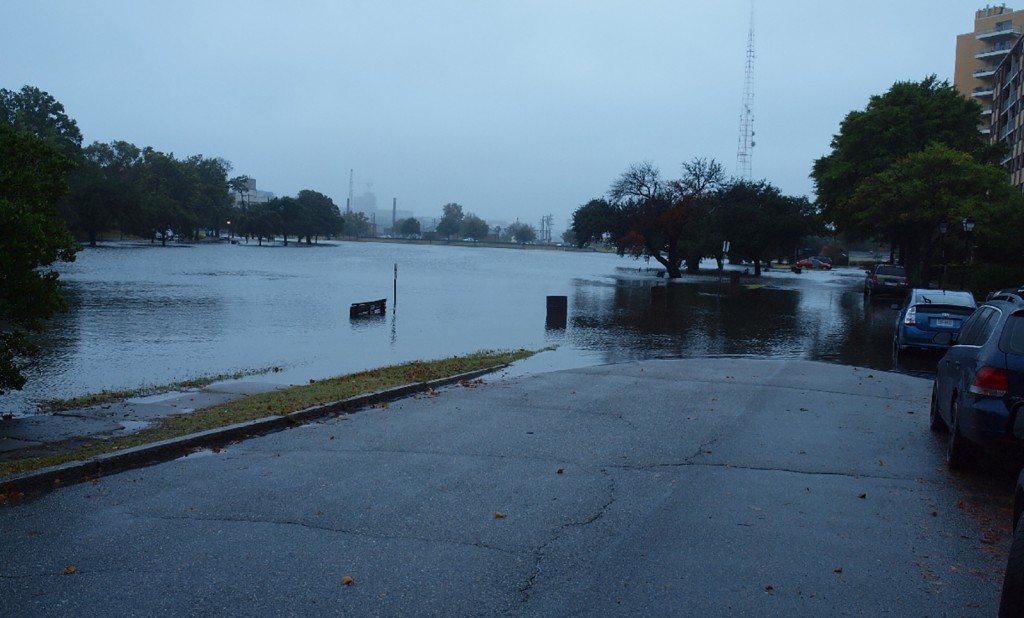
FIGURE 2.
Frequent “nuisance flooding” in Norfolk, Va., is increasingly causing logistical problems and economic damage.

FIGURE 3.
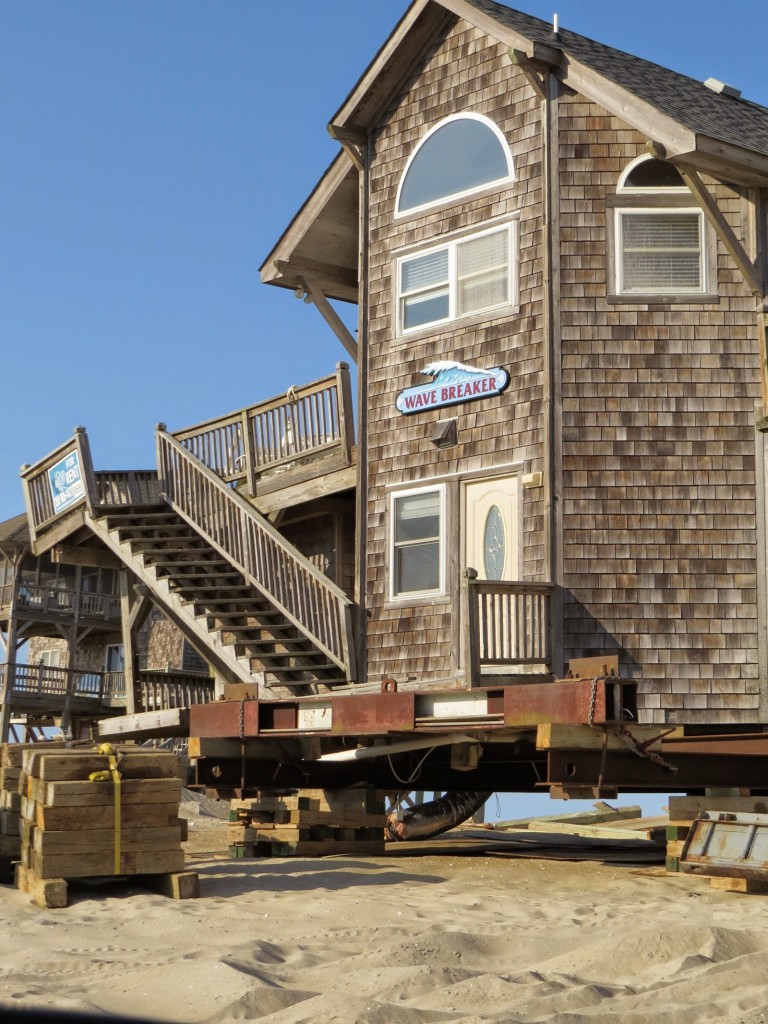
In a transient coastal zone, the built environment might have to be built so that it can be moved as the coastal zone migrates inland. Photo credit: Larry Atkinson.
Who wants to be responsible for our coastal cities not being prepared, if several meters of SLR takes place within a few decades? This would not only drown the coastal cities and infrastructure, it would take away a major share of global productivity, eliminate huge areas of high-value real estate and wealth, destroy much of the coastal defense infrastructure in many countries threatening national and global security, degrade coastal eco-systems, pollute coastal waters and the oceans, impact food and water security, create new health risks, and force unprecedented migration of coastal populations to higher grounds, competing with those already there. A rapid sea level rise could easily turn into a “weapon of mass destruction” (WMD). If that happens, will society turn against the scientists who did not warn assuredly about the threat that is there beyond doubt?
When there was a small chance of Saddam Hussein being in possession of WMDs, the U.S. Vice President Dick Cheney didn’t want to take a chance,no matter how small the probability. He based himself on the “one percent doctrine,” which basically states that if there is a 1% chance that someone has WMDs, it has to be handled as if it was a 95-100% chance.9 Let’s apply this to SLR: based on the most recent scientific discoveries, there is at least a 1% chance that the ice sheets through their contribution to SLR will turn into WMDs, and we should handle this as a 95-100% chance and plan accordingly.
To address successfully the challenge of the “SLR WMD,” we need to better understand the risk associated on local to global scales with every additional meter of SLR. At my university, we have established a “Mitigation and Adaptation Research Institute” (MARI), not least with the mission to assess the risks associated with the tail end of the climate change and sea level rise spectrum as a basis for risk reduction.10
Hampton Roads in Virginia with its complex socio-economic structure and a high rate of SLR (about 5 mm/year) is a “natural climate change and sea-level rise laboratory” for the nation and beyond. More and more of the low-lying area is getting close to the tidal range, or into it, and frequent flooding impacts the population and economy increasingly. For example, a church located on the coast has opened parking areas during high tide to avoid flooding. The mounting risk of extreme flooding combined with insufficient options for horizontal and vertical evacuation creates a general feeling of not being safe.
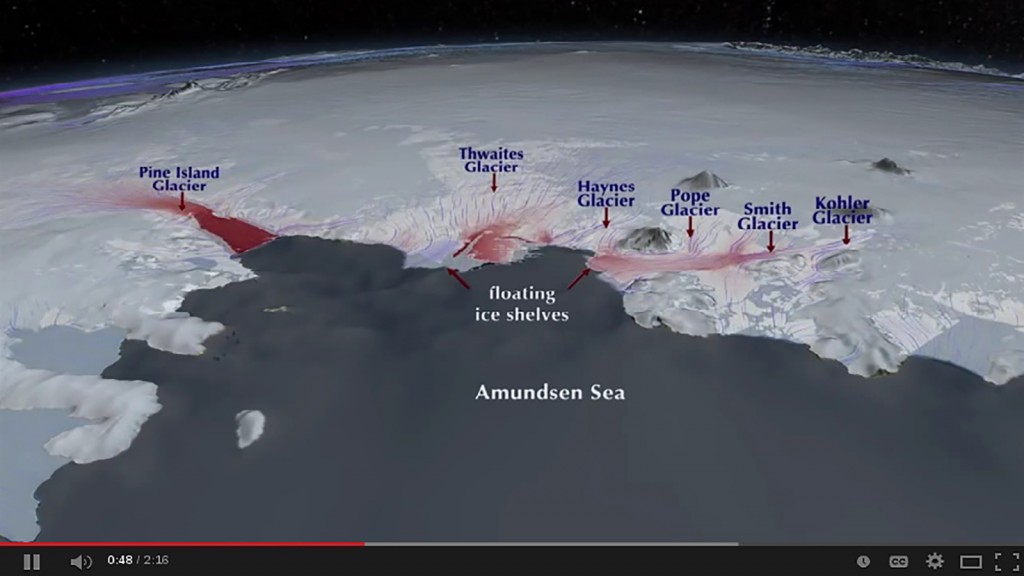
FIGURE 4.
The Amundsen Sea region is the most unstable part of the WAIS. Although it is only a fraction of the whole WAIS, the region contains enough ice to raise global sea levels by 1.2 meters (4 feet). Source: NASA.
MARI is working with a wide range of societal stakeholders to co-create the practice-relevant knowledge needed to reduce the risks and to enjoy the benefits of living in the coastal zone. MARI is a positive step aiming to provide the knowledge not about what will happen, but about what might happen and to develop options that would allow the coastal communities to thrive in a transient coastal zone. Learn more at www.mari.odu.edu.
Endnotes:
1. Church, J.A., P.U. Clark, A. Cazenave, J.M. Gregory, S. Jevrejeva, A. Levermann, M.A. Merrifield, G.A. Milne, R.S. Nerem, P.D. Nunn, A.J. Payne, W.T. Pfeffer, D. Stammer and A.S. Unnikrishnan, 2013: Sea Level Change. In: Climate Change 2013: The Physical Science Basis. Contribution of Working Group I to the Fifth Assessment Report of the Intergovernmental Panel on Climate Change [Stocker, T.F., D. Qin, G.-K. Plattner, M. Tignor, S.K. Allen, J. Boschung, A. Nauels, Y. Xia, V. Bex and P.M. Midgley (eds.)]. Cambridge University Press, Cambridge, United Kingdom and New York, NY, USA.
2. Cabanes,C.,Cazenave,A.,LeProvost,C.,2001.Sea level rise during the 1990s and past 40 years: observations and climate related contributions, Science, 294, 840-842.
3. Velicogna,I.,2009. Increasing rates of ice mass loss from the Greenland and Antarctic ice sheets revealed by GRACE, Geophys. Res. Letters., 36, L19503, doi:10.1029/2009GL040222.
4. NationalResearchCouncil,2013.Abrupt Impacts of Climate Change: Anticipating Surprises. Committee on Understanding and Monitoring Abrupt Climate Change and Its Impacts; Board on Atmospheric Sciences and Climate; Division on Earth and Life Studies, National Research Council, Washington, D.C.
5. Joughin,I.,Smith,B.E.,Medley,B.,2014.MarineIce Sheet Collapse Potentially Under Way for the Thwaites Glacier Basin, West Antarctica, Science, 344, 735-738, DOI: 10.1126/science.1249055.
6. Rignot, E., Mouginot, J., Morlighem, M., Seroussi, H., Scheuchl, B., 2014. Widespread, rapid grounding line retreat of Pine Island, Thwaites, Smith and Kohler glaciers, West Antarctica from 1992 to 2011, Geophys. Res. Letters, DOI: 10.1002/2014GL060140.
7. Morlighem, M., Rignot, E., Mouginot, J., Seroussi, H., Larour, E., 2014. Deeply incised submarine glacial valleys beneath the Greenland ice sheet, Nature Geoscience, 7, 418–422, doi:10.1038/ngeo2167.
8. Weber, M. E., Clark, P. U., Kuhn, G., Timmermann, A., Sprenk, D., Gladstone, R., Zhang, X., Lohmann, G., Menviel, L., Chikamoto, M. O., Friedrich, T., Ohlwein, C., 2014. Millennial-scale variability in Antarctic ice- sheet discharge during the last deglaciation, Nature, 510, 134–138, doi:10.1038/nature13397.
10. See http://www.mari.odu.edu.
